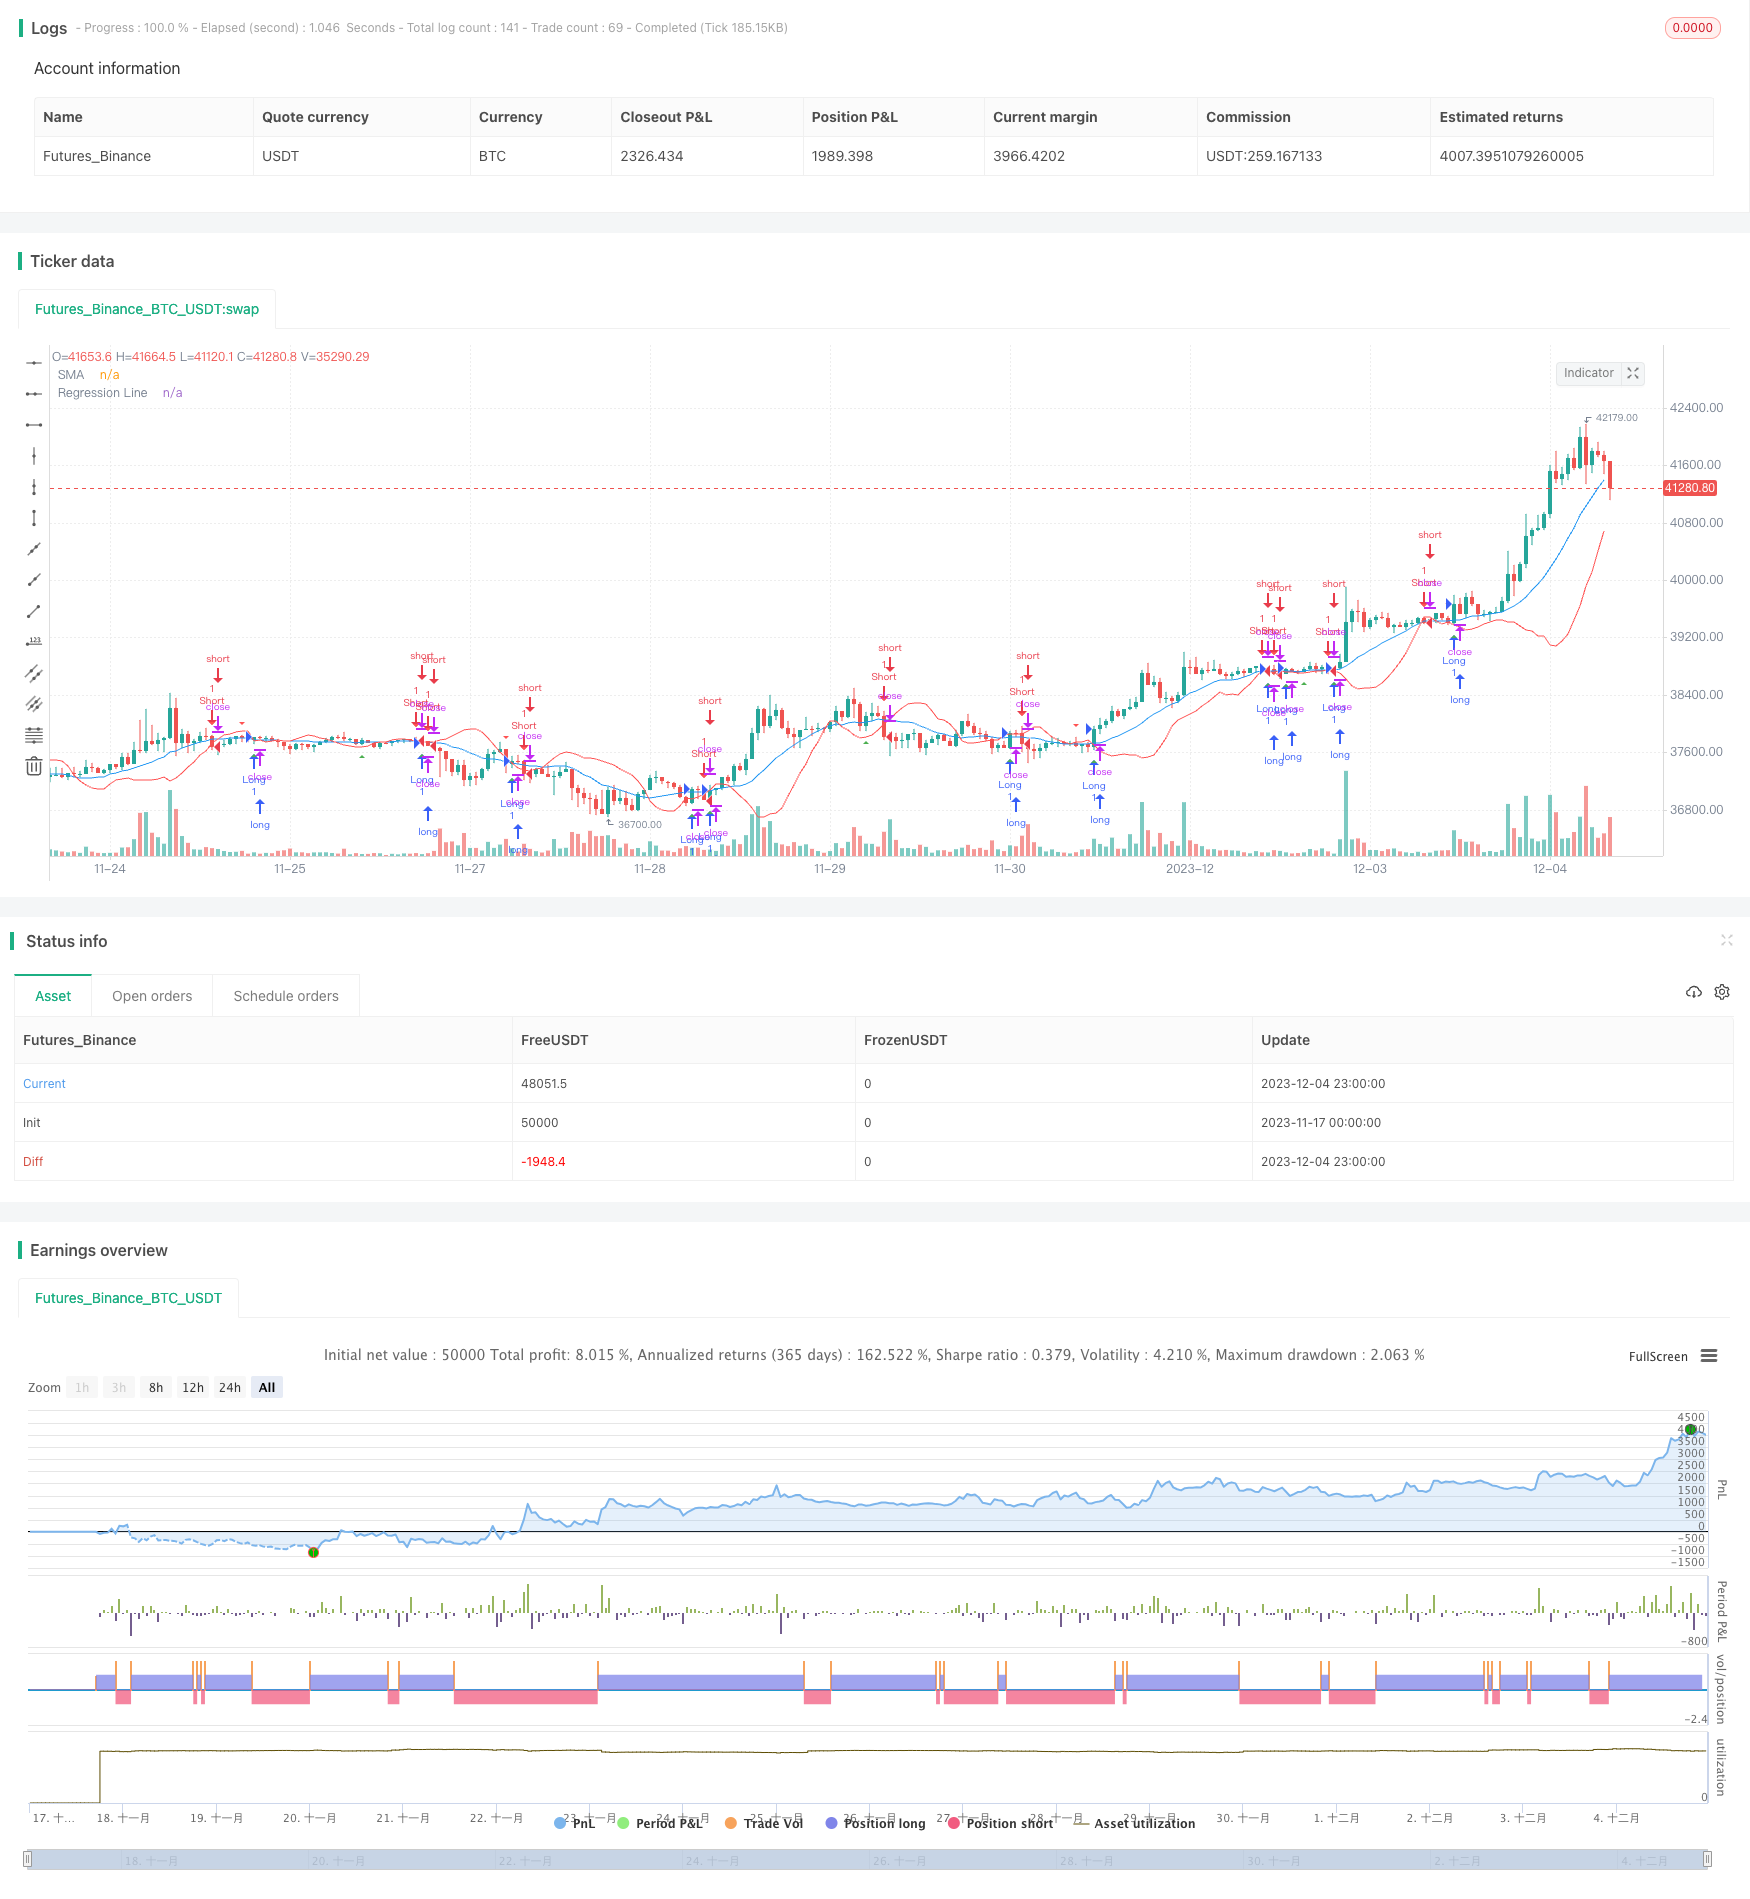
概述
该策略基于线性回归线和移动平均线设计了一个简单的趋势跟踪交易系统。当线性回归线上穿移动平均线时做多,当线性回归线下穿移动平均线时做空。同时结合线性回归线的斜率来过滤部分交易信号,只在趋势方向符合时才入场。
策略名称
Trend Following Regression Trading Strategy(趋势跟踪回归交易策略)
策略原理
该策略包含以下几个关键部分:
- 计算N日简单移动平均线(SMA)
- 计算最近N日的线性回归线
- 当收盘价上穿SMA线且高于回归线时,做多
- 当收盘价下穿SMA线且低于回归线时,做空
- 设置止损价和止盈价
线性回归线能很好地拟合最近一段时间内的趋势方向。这可以用来辅助判断整体趋势的方向。当价格突破SMA线时,我们需要进一步判断线性回归线的方向是否与此突破相符。只有当二者方向一致时,才产生交易信号。这样可以过滤掉部分假突破。
此外,策略还设置了止损机制。当价格触及止损线时,平仓止损。同样也设置了止盈线,锁定部分利润。
策略优势
该策略具有以下优势:
- 结合趋势指标和突破指标,避免假突破,提高信号质量
- 利用线性回归判断趋势方向,进行趋势过滤,只在趋势向上时做多,趋势向下时做空
- 设置了止损和止盈机制来控制风险
- 规则清晰明确,易于理解与实施
- 只需要调整几个参数,无须过于复杂
风险分析
该策略也存在一些风险:
- 在震荡行情中会产生更多错误交易信号
- 移动均线和回归周期的设定需要反复测试优化,不当设置可能影响策略表现
- 极端行情中止损可能被突破造成较大损失
- 仅基于技术指标,没有结合基本面因素
针对这些风险,我们可以从以下几个方面进行优化:
- 在震荡市场中,考虑暂停策略,或使用其他指标过滤
- 对参数进行反复回测,找到最优参数
- 优化和动态调整止损位置
- 结合经济数据等基本面因素
优化方向
该策略主要还可以从以下方面进行优化:
- 增加其他辅助指标判断市场状况,避免在震荡行情下交易
- 优化移动平均线类型,如双移动平均线、三移动平均线等组合
- 对回归线斜率进行进一步分析,添加斜率判断规则
- 结合波动率指标,设定动态止损止盈位置
- 利用机器学习方法自动优化各项参数
总结
该策略整合了移动平均线的趋势跟踪功能与线性回归的趋势判断功能,形成一个相对简单易行的趋势跟踪交易系统。在趋势明显的市场中,该策略可以获得较好的效果。我们还需要对参数与规则进行大量回测与优化,并做好风险控制, then 该策略应当能够获得稳定的投资回报。
策略源码
/*backtest
start: 2023-11-17 00:00:00
end: 2023-12-05 00:00:00
period: 1h
basePeriod: 15m
exchanges: [{"eid":"Futures_Binance","currency":"BTC_USDT"}]
*/

//@version=4
strategy(title="Regression Trading Strategy", shorttitle="RTS", overlay=true)

// Input parameters
n = input(14, title="SMA Period")
stop_loss_percentage = input(2, title="Stop Loss Percentage")
take_profit_percentage = input(2, title="Take Profit Percentage")

// Calculate the SMA
sma = sma(close, n)

// Linear regression function
linear_regression(src, length) =>
    sumX = 0.0
    sumY = 0.0
    sumXY = 0.0
    sumX2 = 0.0
    for i = 0 to length - 1
        sumX := sumX + i
        sumY := sumY + src[i]
        sumXY := sumXY + i * src[i]
        sumX2 := sumX2 + i * i
    slope = (length * sumXY - sumX * sumY) / (length * sumX2 - sumX * sumX)
    intercept = (sumY - slope * sumX) / length
    line = slope * length + intercept
    line

// Calculate the linear regression
regression_line = linear_regression(close, n)

// Plot the SMA and regression line
plot(sma, title="SMA", color=color.blue)
plot(regression_line, title="Regression Line", color=color.red)

// Trading strategy conditions
long_condition = crossover(close, sma) and close > regression_line
short_condition = crossunder(close, sma) and close < regression_line

// Exit conditions
stop_loss_price = close * (1 - stop_loss_percentage / 100)
take_profit_price = close * (1 + take_profit_percentage / 100)

// Plot entry and exit points on the chart
plotshape(series=long_condition, title="Long Entry", location=location.belowbar, color=color.green, style=shape.triangleup, size=size.small)
plotshape(series=short_condition, title="Short Entry", location=location.abovebar, color=color.red, style=shape.triangledown, size=size.small)
plotshape(series=crossunder(close, stop_loss_price), title="Stop Loss", location=location.abovebar, color=color.red, style=shape.labeldown, text="SL")
plotshape(series=crossover(close, take_profit_price), title="Take Profit", location=location.belowbar, color=color.green, style=shape.labelup, text="TP")

// Strategy orders
strategy.entry("Long", strategy.long, when = long_condition)
strategy.entry("Short", strategy.short, when = short_condition)
strategy.exit("Exit", from_entry = "Long", when = crossover(close, stop_loss_price) or crossover(close, take_profit_price))
strategy.exit("Exit", from_entry = "Short", when = crossunder(close, stop_loss_price) or crossunder(close, take_profit_price))