The Wave Trend Trading Strategy Based on LazyBear

Overview
This is a trading strategy based on LazyBear's Wave Trend indicator. The strategy identifies market sentiment through computing the wave trend of price fluctuations, and makes long and short decisions accordingly.
Strategy Logic
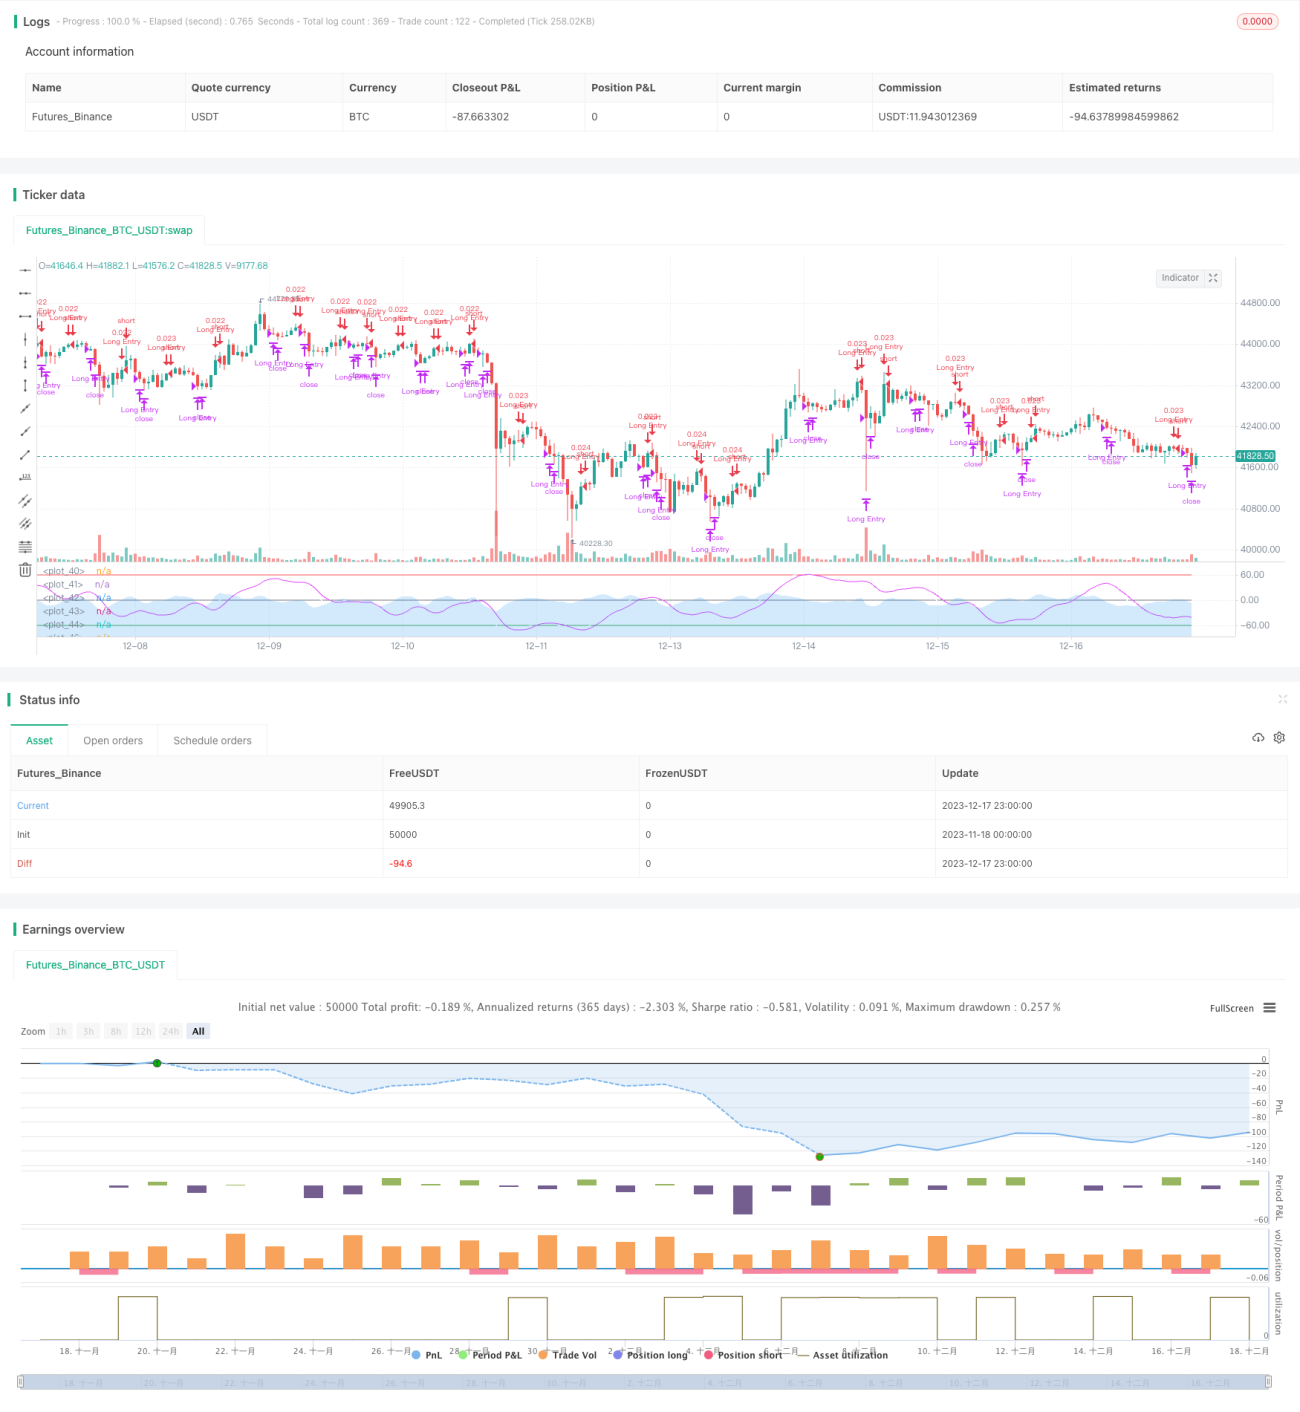
The core of this strategy is LazyBear's Wave Trend indicator. It first calculates the average price (AP), then the exponential moving average of AP (ESA) and the absolute price movement (D). Based on ESA and D the strategy calculates the Volatility Index (CI), which then feeds into an exponential moving average to generate the Wave Trend line (WT). WT is further processed into WT1 and WT2 using simple moving averages. When WT1 crosses over WT2, it triggers the golden cross and goes long. When WT1 crosses below WT2, it triggers the death cross and goes short.
Advantage Analysis
This is a very simple but practical trend following strategy. The main advantages are:
- It identifies price trend and market sentiment clearly based on the Wave Trend indicator
- Simple trading logic of going long/short based on golden/death crosses of WT lines
- Customizable parameters to adjust sensitivity of WT for different cycles
- Flexibility to add further filters such as trading time window
Risk Analysis
There are some risks to this strategy:
- As a trend following strategy, it can generate many false signals during range-bound markets
- The lagging nature of WT may cause missed turns
- Default parameters may not suit all products and cycles
- No stop loss mechanism, holding period can be very long
The main solutions are:
- Optimize parameters to tune sensitivity of WT
- Add other indicators for confirmation to avoid false signals
- Employ stop loss and take profit
- Limit daily trades or positions
Optimization Directions
There is room for further optimization:
- Optimize WT parameters for better sensitivity or stability
- Use different parameter sets based on cycles
- Add indicators like volume, volatility for confirmation
- Add stop loss and take profit
- Enrich trading logic like pyramiding, grid trading
- Explore better features and rules using machine learning
Summary
In summary, this is a very simple and practical wave trend following strategy. By modeling the wave trend of price fluctuations, it identifies overbought and oversold market conditions to generate trade signals using WT's golden crosses and death crosses. The strategy is easy to implement but may require further optimization for sensitivity and stability. As a trend following strategy, it also needs additional filters and logic to avoid false signals. Overall this serves as a useful strategy template with lots of room for improvements.
- 1