Bollinger Band Breakout Trading Strategy

Overview
This strategy is based on the upper and lower rails of the Bollinger Bands to determine when the price breaks through the upper rail of the Bollinger Bands to go long and breaks through the lower rail to go short. It belongs to the trend tracking type of strategy.
Strategy Logic
This strategy uses the middle / upper / lower rail of the Bollinger Bands to determine extreme price ranges. The middle rail is the simple moving average of closing prices over the past 25 periods. The upper and lower rails are one standard deviation above and below the middle rail. When the price breaks through the upper or lower rail, it indicates that there is a breakout and abnormal price behavior, which can be used to make trading decisions.
If the price is below the lower rail, go long. If the price is above the upper rail, go short. When going long, set the stop loss to the entry price multiplied by the stop loss factor and take profit to the entry price multiplied by the take profit factor.
The strategy also incorporates some auxiliary rules, such as allowing only one signal per 24 hours to avoid unnecessary trading.
Advantages of the Strategy
- Using Bollinger Bands to determine abnormal price ranges belongs to trend tracking strategies that can capture price trends.
- Stop loss and take profit parameters are set according to principles to control single loss.
- Some auxiliary rules are added to avoid duplicate signals and unnecessary trading.
Risks of the Strategy
- Bollinger Bands cannot fully represent price trends, and there may be false signals.
- Improper timing of breakout signals can lead to losses.
- The duration and momentum of trend or non-trend markets are difficult to predict, which may lead to unnecessary long positions.
Risk Management:
- Adjust Bollinger Band parameters to optimize breakout signal timing.
- Incorporate other indicators to determine the major trend.
- Set stop loss and take profit range according to different products and market conditions.
Optimization Directions
- Consider adaptive optimization of Bollinger Band parameters to make them fit better to current market conditions.
- Incorporate other indicators to judge reliability of trend signals and avoid false signals.
- Incorporate machine learning models to automatically identify optimal long and short timing.
Conclusion
In summary, this is a simple trend tracking strategy using Bollinger Bands to determine abnormal prices and track trends. There is room for improvement in parameter optimization, risk control and signal filtering, but the core idea is simple and clear, making it suitable as a beginner strategy for learning.
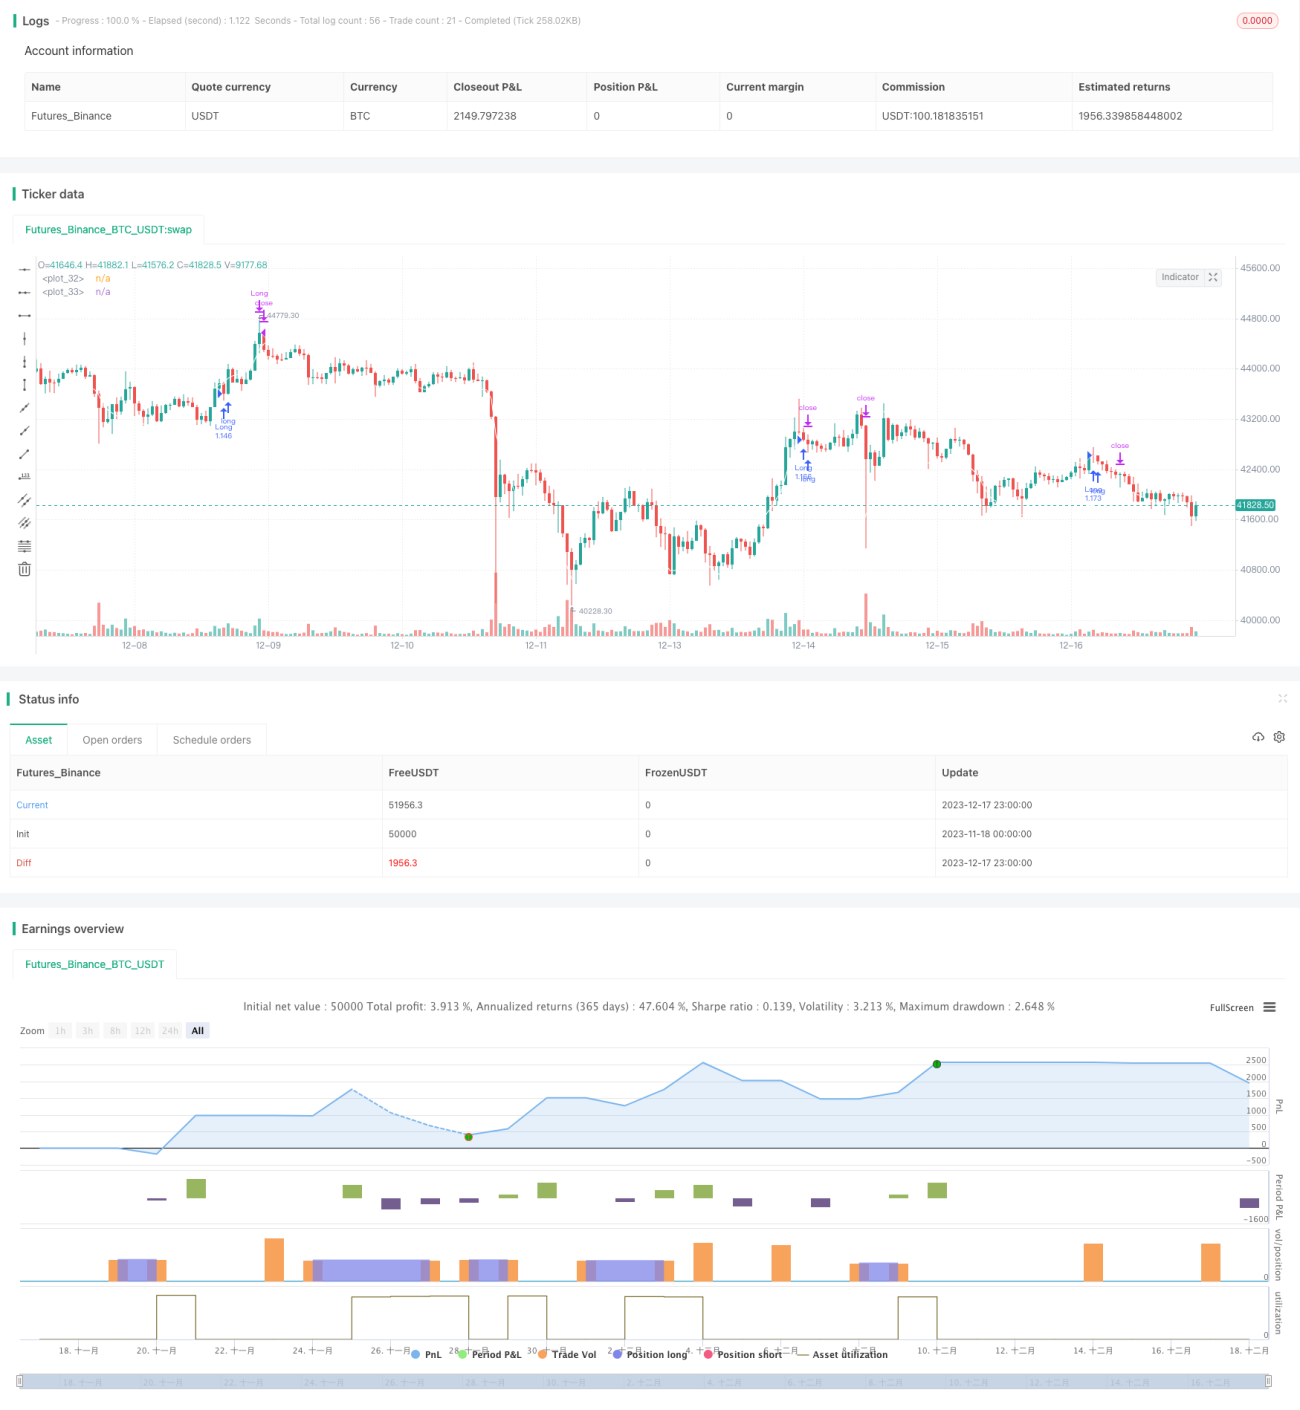
/*backtest
start: 2023-11-18 00:00:00
end: 2023-12-18 00:00:00
period: 1h
basePeriod: 15m
exchanges: [{"eid":"Futures_Binance","currency":"BTC_USDT"}]
*/

//@version=5
strategy("I11L OIL Bot",overlay=true, initial_capital=1000000,default_qty_value=1000000,default_qty_type=strategy.cash,commission_type=strategy.commission.percent,commission_value=0.00)

leverage = input.float(1,"Leverage (x)",step=1)- 1