A Momentum Tracking Mean Reversion Strategy

Overview
This strategy uses multiple indicators including moving averages, Bollinger Bands, RSI and Stochastics across different timeframes to design a strategy that utilizes momentum indicators to determine market reversals.
How It Works
The core logic of this strategy is to track crosses of short-term and long-term moving averages to identify bottoms and tops, while referring to momentum indicators like RSI and Stochastics for additional confirmation of overbought and oversold conditions.
Specifically, it plots two moving averages with different parameters, a shorter one to determine the current trend and a longer one for the major trend. When the shorter moving average crosses above the longer moving average from below, it signals a reversal and generates a buy signal. When crossing down, it generates a sell signal.
In addition, the strategy also checks whether RSI has entered the oversold territory and if the Stochastics K line has entered the oversold area to confirm bottoming signals. The reverse logic is used to confirm topping signals.
On the exit side, the strategy uses take profit, stop loss and trailing stop mechanisms to manage positions.
Advantage Analysis
This is a strategy combining trend following and reversal identification, while also incorporating momentum indicators. The main advantages are:
-
Crossovers of moving averages are simple yet effective ways to identify reversals. Dual moving average strategies are easy to implement and have good historical performance.
-
Combining indicators like RSI adds reliability to reversal signals, avoiding false signals at non-bottoms or non-tops.
-
Take profit, stop loss and trailing stop mechanisms help lock in profits and control risk.
Risk Analysis
Despite its advantages, some risks to note include:
-
Dual moving average strategies can get whipsawed in ranging markets, frequently opening and closing positions when prices oscillate in sideways moves.
-
Indicators like RSI cannot fully prevent incorrect signals. For example, quickly breaking previous highs could stop RSI from reaching overbought territory.
-
Stop loss levels set too wide increase risk of larger losses. Stop loss percentages need to be adjusted based on the specifics of each market.
Optimization Directions
Some ways this strategy can be further optimized:
-
Different types of moving averages can be tested to find the best fit for the strategy.
-
More complementary indicators like MACD, KDJ, Bollinger Bands can be added to enrich the logic.
-
Machine learning can be used to automatically optimize position sizing and profit taking/stopping parameters.
-
Parameters can be separately optimized for different products based on their characteristics.
Conclusion
In summary, the Momentum Tracking Mean Reversion Strategy is a simple yet practical quant strategy. It uses moving average crossovers to determine reversal points, confirms signal reliability with momentum indicators, and manages positions intelligently to lock in profits and control risk. Easy to understand and implement, it is a good starting point for traders to learn algorithmic trading strategies.
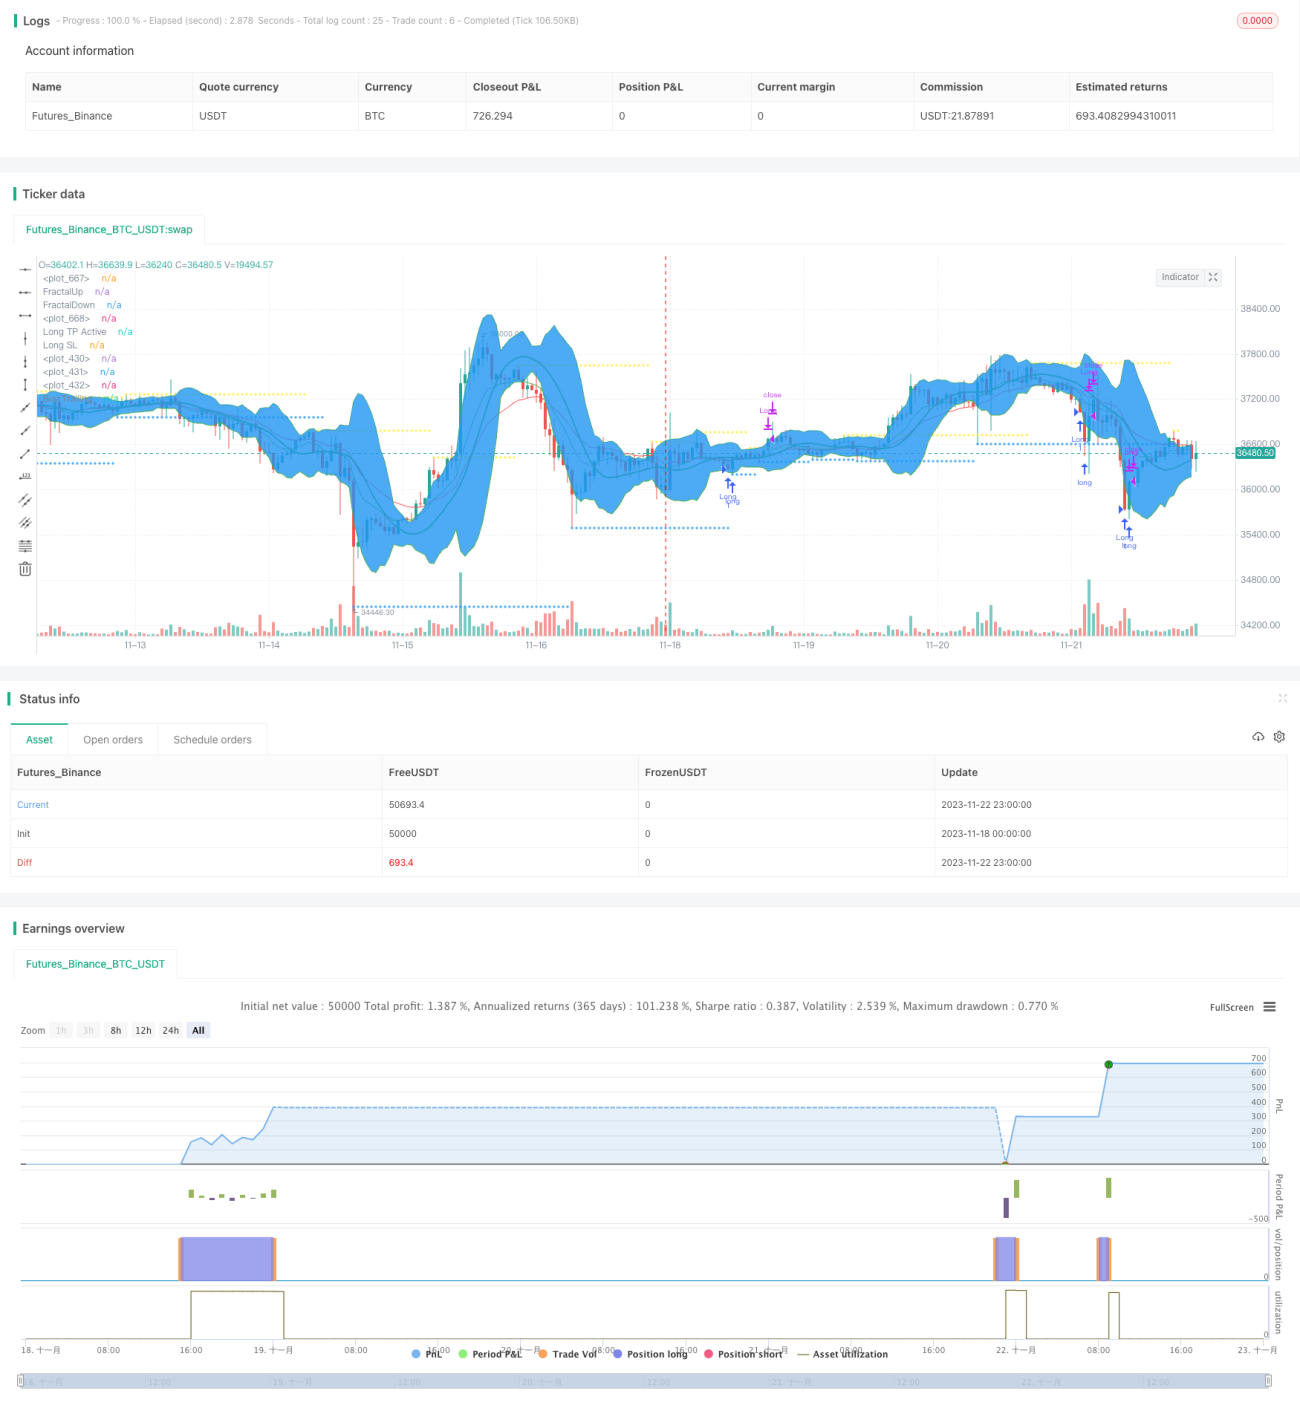
/*backtest
start: 2023-11-18 00:00:00
end: 2023-11-23 00:00:00
period: 1h
basePeriod: 15m
exchanges: [{"eid":"Futures_Binance","currency":"BTC_USDT"}]
*/

//@version=3
strategy("APEX - Tester - Buy/Sell Strategies - Basic - BACKTESTER", overlay = true)
//study("APEX - Tester - Buy/Sell Strategies - Basic ", overlay = true)
source_main = close- 1