Volatility Finite Volume Elements Strategy

Overview
This strategy is an improvement based on the Finite Volume Elements (FVE) indicator. FVE is a pure volume indicator that does not consider price changes, but only focuses on fund inflows and outflows. This strategy colors trading volume based on volatility on the basis of FVE to judge market sentiment and fund flows.
Strategy Principle
The strategy calculates intraday volatility Intra and interday volatility Inter, combined with their standard deviations Vintra and Vinter, to obtain the volatility threshold CutOff. Then it calculates the difference MF between median price, previous median price and volume to judge fund inflow (positive) or outflow (negative). If MF exceeds CutOff, it means trading volume and volatility are in the same direction and there is obvious enthusiasm in the market, the color is set to green; if MF is below negative CutOff, it means trading volume and volatility are in the same direction and there is obvious pessimism in the market, the color is set to red; otherwise the color is blue. Finally, determine the long/short direction based on color.
Advantage Analysis
The strategy combines trading volume and volatility indicators to judge market sentiment more accurately. Compared with single indicators, it has the advantages of stability and reliability in judgment. In addition, the judgment criteria of this strategy are specially designed for volatility and can adapt well to changes in different market conditions.
Risk Analysis
The strategy relies on trading volume and volatility indicators. Discrepancies between the two will affect judgment. In addition, parameter settings have a greater impact on results, with large differences in results from different varieties and parameter combinations, requiring targeted optimization.
Optimization Directions
Consider combining other indicators to assist in judgment, such as MACD, OBV, etc., to avoid noise from trading volume and volatility. It is also possible to design an adaptive parameter mechanism to dynamically adjust parameters according to different market conditions to improve stability. Or we can backtest and optimize parameters to find the best parameter portfolio for specific varieties.
Summary
The strategy integrates the advantages of trading volume and volatility indicators to judge the level of market enthusiasm. Compared with single indicators, it has higher judgment accuracy and stability. However, parameter settings and variety differences have significant effects on the results, and further optimization and adjustment are still needed to adapt to various trading environments. Overall, the strategy has a reasonable theoretical basis and great potential for improvement.
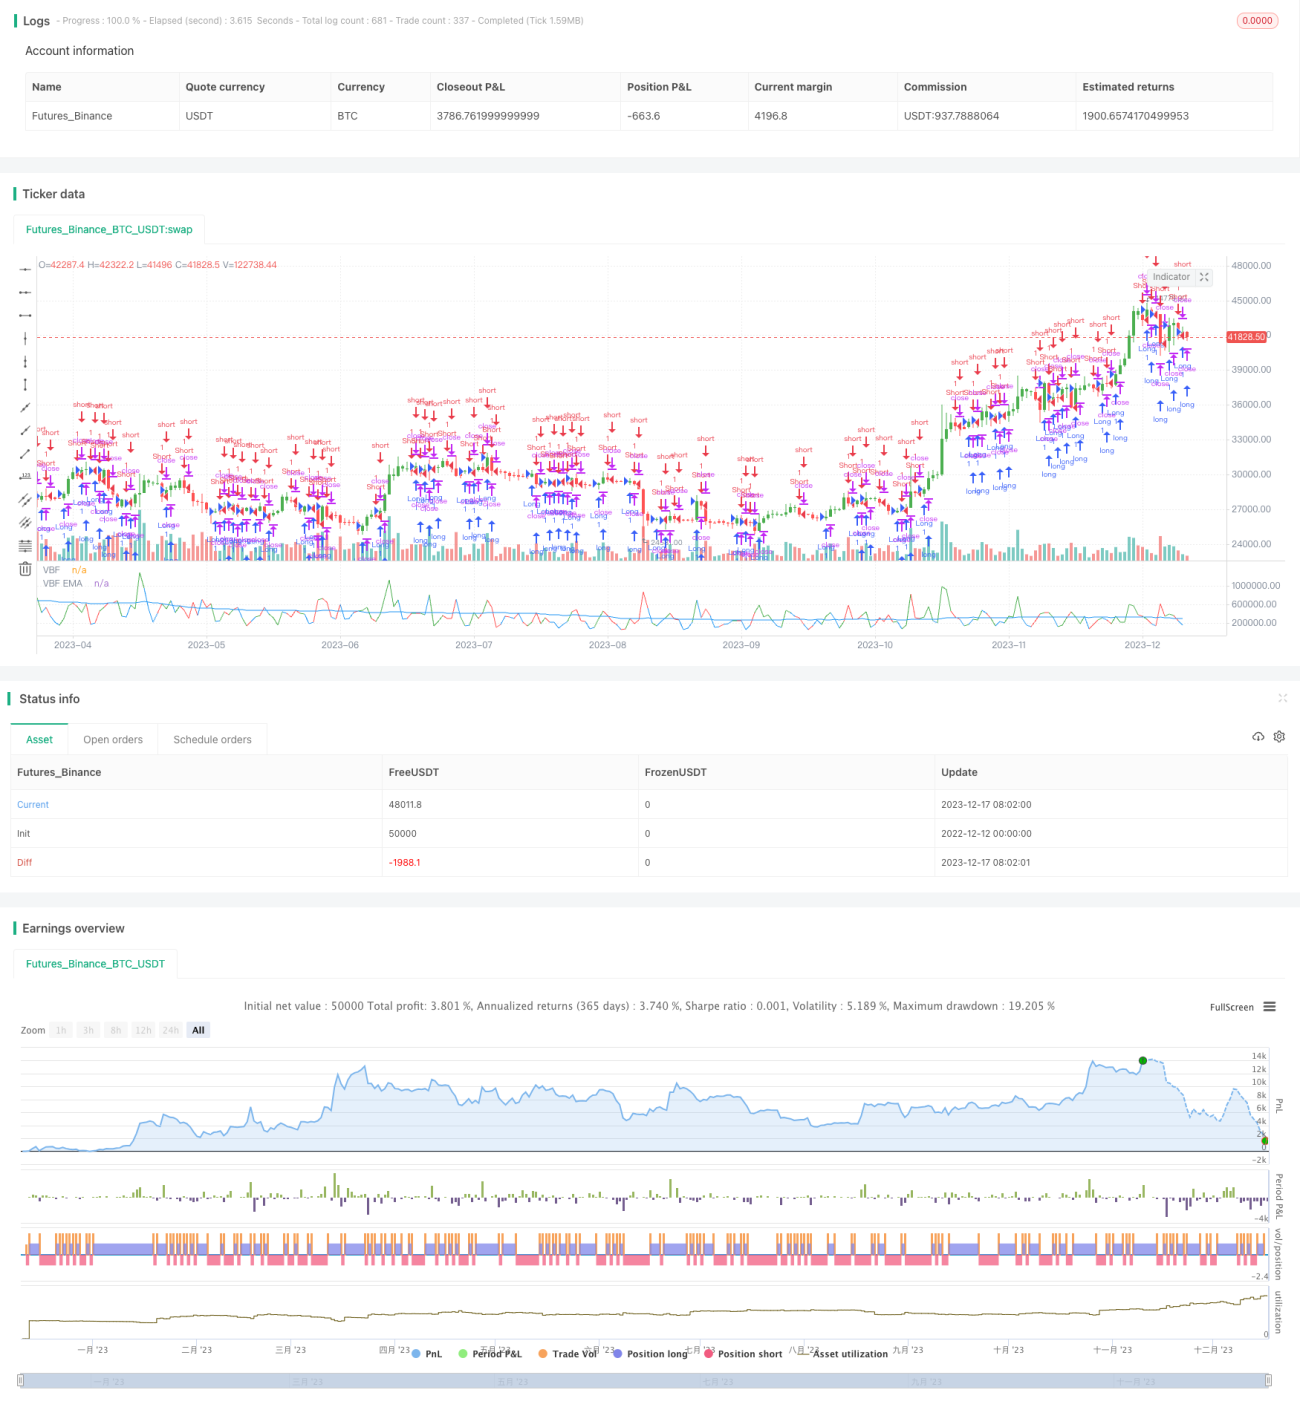
/*backtest
start: 2022-12-12 00:00:00
end: 2023-12-18 00:00:00
period: 1d
basePeriod: 1h
exchanges: [{"eid":"Futures_Binance","currency":"BTC_USDT"}]
*/

//@version=2
////////////////////////////////////////////////////////////
//  Copyright by HPotter v1.0 22/08/2017
// The FVE is a pure volume indicator. Unlike most of the other indicators - 1