Bill Williams Awesome Oscillator Trading Strategy

Overview
The Bill Williams Awesome Oscillator trading strategy is a quantitative trading strategy developed based on the recommendations proposed by Bill Williams in his book “New Trading Dimensions”. The strategy uses the difference between fast and slow moving averages to construct an oscillator indicator and displays it as a histogram, generating trading signals through color changes of the histogram.
Strategy Logic
The core indicator of this strategy is the Awesome Oscillator (AO). Its formula is:
AO = SMA(Median Price, Fast Length) - SMA(Median Price, Slow Length)
Where Median Price takes the average of high and low prices; Fast Length represents the period of the fast moving average; Slow Length represents the period of the slow moving average.
The AO indicator reflects the oscillation of market prices at different time scales through the difference between fast and slow moving averages. When the fast moving average is higher than the slow one, it signals that short-term price momentum is stronger than long-term momentum and gives a buy signal. When the fast moving average is lower than the slow one, it signals that short-term price momentum is weaker than long-term momentum and gives a sell signal.
The strategy uses the difference between the current AO value and its previous period to determine the current period’s long/short stance. Different colors are used to identify them on the histogram: blue when current AO is greater than previous period, indicating suitable for long; red when current AO is less than previous period, indicating suitable for short.
Advantage Analysis
The main advantages of this strategy include:
- Using the difference between moving averages to construct the indicator smooths price data and helps filter market noise;
- The difference between fast and slow moving averages captures price trend changes across different time horizons;
- The histogram visually presents long/short status for ease of judging trading direction;
- Customizable parameters to adjust indicator sensitivity catering to different trading instruments.
Risk Analysis
There are also some risks with this strategy:
- Improper parameter settings may result in frequent trading signals, leading to overtrading;
- The relatively complex construction of the AO indicator may lead to missing trading opportunities if parameters are not properly set;
- Signals come from a single source lacking verification from other indicators.
To mitigate the above risks, parameters can be optimized, indicator construction can be adjusted, and other indicators can be used for verification.
Optimization Directions
Some directions this strategy can be optimized on include:
- Optimize fast and slow moving average lengths to find the best parameter combination;
- Try different types of moving averages to construct the AO indicator, e.g. EMA, LWMA, etc;
- Incorporate trend-following and oscillating indicators to improve the AO;
- Add stop loss mechanisms to control losses per trade.
Conclusion
In conclusion, the Bill Williams Awesome Oscillator trading strategy effectively identifies short-term reversal opportunities by judging price trend changes using the difference between fast and slow moving averages. This strategy has a clear concept and is easy to implement. With parameter optimization and incorporation of other indicators, it has the potential to achieve good trading performance.
/*backtest
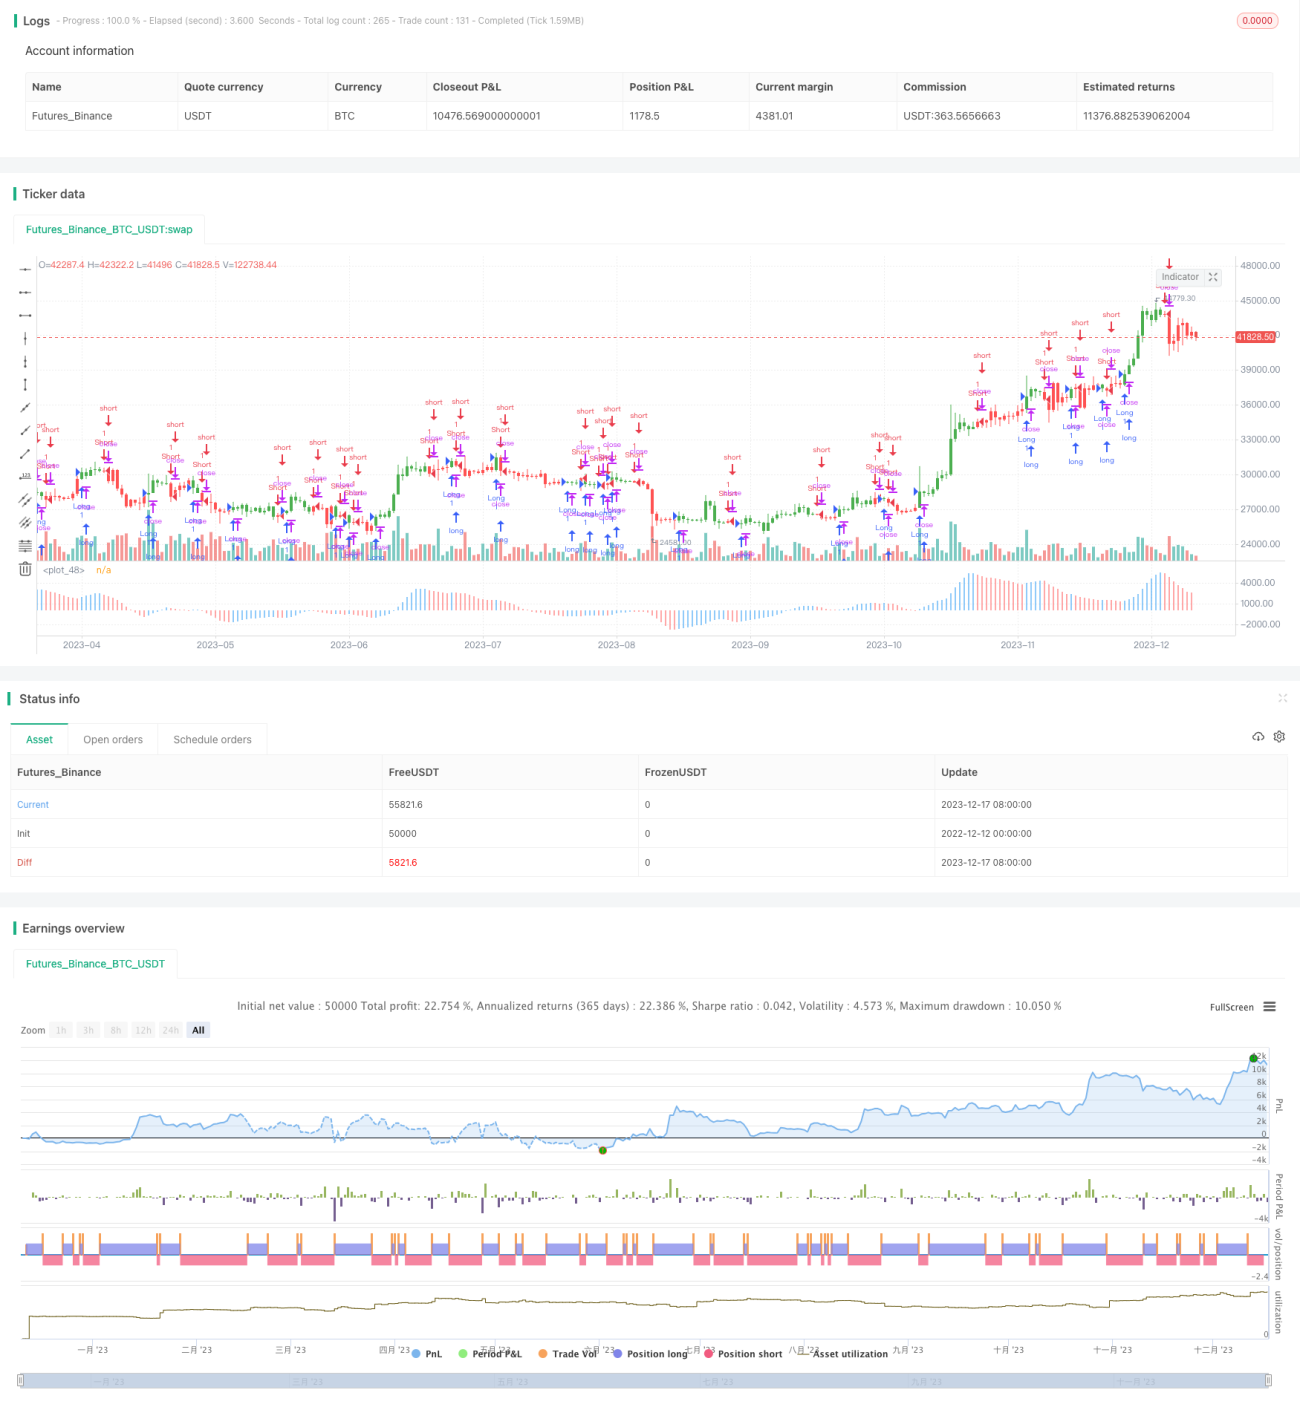
start: 2022-12-12 00:00:00
end: 2023-12-18 00:00:00
period: 1d
basePeriod: 1h
exchanges: [{"eid":"Futures_Binance","currency":"BTC_USDT"}]
*/
//@version=2
////////////////////////////////////////////////////////////
// Copyright by HPotter v1.0 29/12/2016
// This indicator is based on Bill Williams` recommendations from his book - 1