Momentum Breakout Trading Strategy

Author: ChaoZhang, Date: 2023-12-19 15:46:38
Tags:

img

Overview

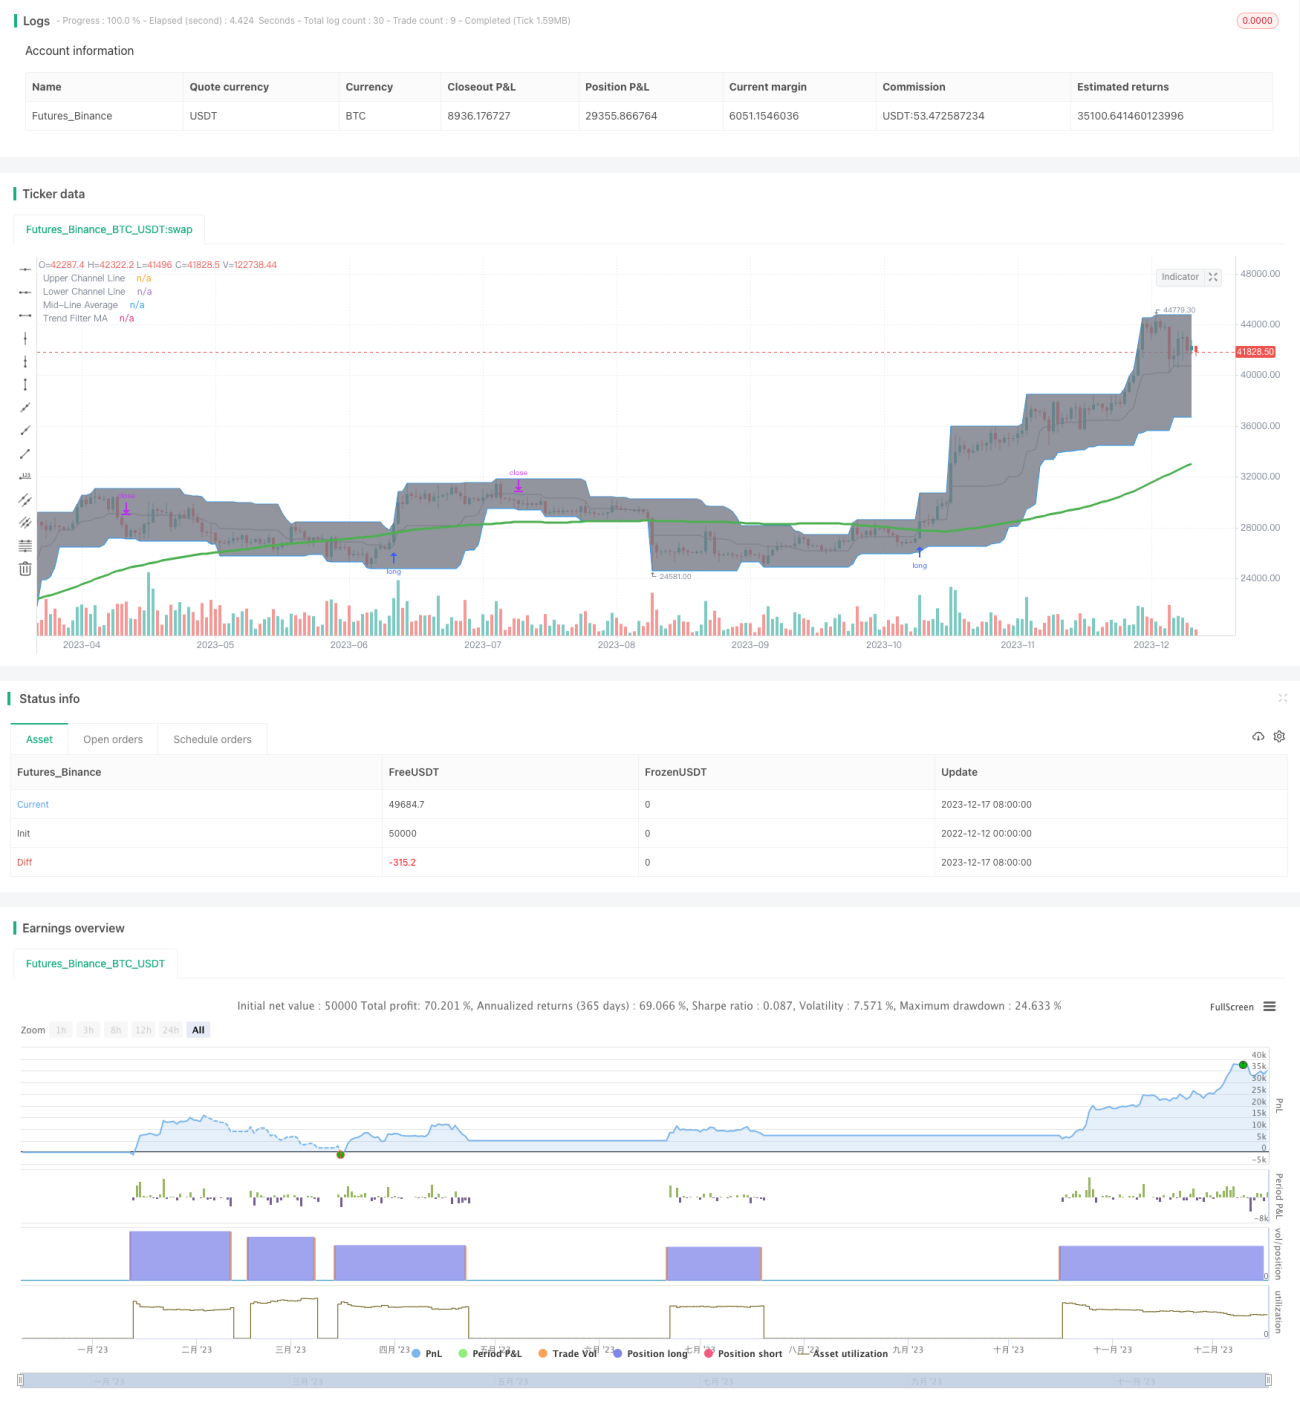
The Momentum Breakout Trading Strategy is a trend-following strategy that generates trading signals by detecting price breakouts beyond key support/resistance levels. This strategy utilizes the Donchian Channel indicator to dynamically identify key support/resistance levels and further filters signals with moving averages to avoid erroneous trades.

Strategy Logic

The core indicator of this strategy is the Donchian Channel. The Donchian Channel consists of the highest price, lowest price, and midline price over a set period. The upper and lower band of the channel connect the highest and lowest prices accordingly over the lookback period. A long signal is generated when the price breaks above the upper band, while a short signal is generated on a break below the lower band, reflecting shifts in market momentum.

The moving average is used to gauge the trend direction. Only buy signals with the price above the moving average are taken so as to avoid consolidations.

Specifically, the entry condition consists of: Price breaks out above the Donchian Channel upper band AND closes above the moving average. The exit condition is: Price breaks below the Donchian Channel lower band.

The stop loss trails the Donchian Channel lower band, ensuring the stop adjusts higher along with the trend.

Advantage Analysis

This strategy effectively combines two indicators to judge trend direction and momentum, avoiding erroneous trades from false breakout signals. Meanwhile, the trailing stop allows the strategy to maximize trend following profits.

Specifically, the advantages are:

  1. The Donchian Channel dynamically determines key support/resistance levels, identifying trend turning points.

  2. The moving average filters out consolidations, avoiding unnecessary whipsaws.

  3. Trailing the Donchian Channel lower band allows profits to be maximized.

  4. Reasonable parameters provide flexibility across various market environments.

Risk Analysis

The main risks faced:

  1. Failed breakout risk - Price fails to sustain the momentum post breakout above upper band.

  2. Trend reversal risk - Price reverses prior to hitting the trailing stop loss.

  3. Parameter optimization risk - Ineffective parameters lead to overtrading or insufficient signals.

To mitigate, factors like volume confirmation, moving average tuning, reasonable stop distances should be incorporated.

Enhancement Opportunities

Further optimizations:

  1. Add volume filter to ensure high momentum breakouts.

  2. Optimize moving average periods for instrument characteristics.

  3. Adaptive stop loss mechanism based on price volatility dynamics.

  4. Re-entry mechanism after initial stop out to capture additional trend resumption moves.

  5. Robust multi-market testing to identify parameters by product nuances.

Conclusion

The Momentum Breakout Trading Strategy combines indicators to effectively gauge trend and momentum strength, avoiding the common issues faced by trend systems regarding blind entries. Reasonably optimized parameters, adaptive mechanisms, and robust testing across various environments and products make this is a versatile and practical breakout system.


/*backtest
start: 2022-12-12 00:00:00
end: 2023-12-18 00:00:00
period: 1d
basePeriod: 1h
exchanges: [{"eid":"Futures_Binance","currency":"BTC_USDT"}]
*/

//@version=4

// Revision:        1
// Author:          @millerrh
// Strategy:  
//      Entry: Buy when Donchian Channel breaks out
//      Exit: Trail a stop with the lower Donchian Channel band
// Conditions/Variables:
//    1. Can add a filter to only take setups that are above a user-defined moving average (helps avoid trading counter trend) 
//    2. Manually configure which dates to back test
//    3. User-Configurable DC Channel length


// === CALL STRATEGY/STUDY, PROGRAMATICALLY ENTER STRATEGY PARAMETERS HERE SO YOU DON'T HAVE TO CHANGE THEM EVERY TIME YOU RUN A TEST ===
// (STRATEGY ONLY) - Comment out srategy() when in a study() 
strategy("Donchian Breakout", overlay=true, initial_capital=10000, currency='USD', 
   default_qty_type=strategy.percent_of_equity, default_qty_value=100, commission_type=strategy.commission.percent, commission_value=0.1)
// (STUDY ONLY) - Comment out study() when in a strategy() 
//study("Donchian Breakout", overlay=true)


// === BACKTEST RANGE ===
From_Year  = input(defval = 2019, title = "From Year")
From_Month = input(defval = 1, title = "From Month", minval = 1, maxval = 12)
From_Day   = input(defval = 1, title = "From Day", minval = 1, maxval = 31)
To_Year    = input(defval = 9999, title = "To Year")
To_Month   = input(defval = 1, title = "To Month", minval = 1, maxval = 12)
To_Day     = input(defval = 1, title = "To Day", minval = 1, maxval = 31)
Start  = timestamp(From_Year, From_Month, From_Day, 00, 00)  // backtest start window
Finish = timestamp(To_Year, To_Month, To_Day, 23, 59)        // backtest finish window

// == INPUTS ==
trigInput = input(title = "Execute Trades On...", defval = "Wick", options=["Wick","Close"]) // Useful for comparing standing stop orders vs. waiting for candle closes prior to action
stopTrail = input(title = "Trail Stops On...", defval = "ATR", options = ["ATR","Bottom of DC Channel","Midline of DC Channel","Tightest of ATR/Bot DC Channel"])
dcPeriod = input(title="DC period", type=input.integer, defval=20)

// === PLOT THE DONCHIAN CHANNEL ===
// Logic
dcUpper = highest(high, dcPeriod)
dcLower = lowest(low, dcPeriod)
dcMid = avg(dcUpper, dcLower)

// Plotting
dcUplot = plot(dcUpper, color=color.blue, linewidth=1, title="Upper Channel Line")
dcLplot = plot(dcLower, color=color.blue, linewidth=1, title="Lower Channel Line")
dcMidPlot = plot(dcMid, color=color.gray, linewidth=1, title="Mid-Line Average")
fill(dcUplot, dcLplot, color=color.gray, transp=90)

// == FILTERING ==
// Inputs
useMaFilter = input(title = "Use MA for Filtering?", type = input.bool, defval = true)
maType = input(defval="SMA", options=["EMA", "SMA"], title = "MA Type For Filtering")
maLength   = input(defval = 100, title = "MA Period for Filtering", minval = 1)

// Declare function to be able to swap out EMA/SMA
ma(maType, src, length) =>
    maType == "EMA" ? ema(src, length) : sma(src, length) //Ternary Operator (if maType equals EMA, then do ema calc, else do sma calc)
maFilter = ma(maType, close, maLength)
plot(maFilter, title = "Trend Filter MA", color = color.green, linewidth = 3, style = plot.style_line, transp = 50)

// Check to see if the useMaFilter check box is checked, this then inputs this conditional "maFilterCheck" variable into the strategy entry 
maFilterCheck = if useMaFilter == true
    maFilter
else
    0

// == ENTRY AND EXIT CRITERIA ==
// Trigger stop based on candle close or High/Low (i.e. Wick) - If doing daily timeframe, can do candle close.  Intraday should use wick.
trigResistance = trigInput == "Close" ? close : trigInput == "Wick" ? high : na
trigSupport = trigInput == "Close" ? close : trigInput == "Wick" ? low : na
buySignal = trigResistance >= dcUpper[1] // The [1] looks at the previous bar's value as it didn't seem to be triggering correctly without it (likely) DC moves with each bar
sellSignal = trigSupport <= dcLower[1]

buy = buySignal and dcUpper[1] > maFilterCheck // All these conditions need to be met to buy


// (STRATEGY ONLY) Comment out for Study
// This string of code enters and exits at the close
if (trigInput == "Close")
    strategy.entry("Long", strategy.long, when = buy)
    strategy.close("Long", when = sellSignal)

// This string of code enters and exits at the wick (i.e. with pre-set stops)
if (trigInput == "Wick")
    strategy.entry("Long", strategy.long, stop = dcUpper[1], when = time > Start and time < Finish and dcUpper[1] > maFilterCheck)
    strategy.exit("Exit Long", from_entry = "Long", stop = dcLower[1])


More