Dual-Track Fast Quantitative Reversal Trading Strategy

Overview
This is a dual-track reversal trading strategy based on price channel, Bollinger bands and fast RSI indicator. It combines channel index to identify trends, Bollinger bands to recognize support and resistance levels, and fast RSI to detect overbought and oversold signals, in order to achieve efficient reversal trading.
Strategy Logic
The strategy mainly relies on the following indicators to make trading decisions:
-
Price Channel: Calculates the highest and lowest price over a certain period and plots the channel centerline. Trade signals are generated when the price breaks through the channel.
-
Bollinger Bands: The centerline is the price channel centerline. The upper and lower bands are calculated based on the standard deviation of the deviation of the price from the centerline. Trade signals are generated when the price interacts with the Bollinger bands.
-
Fast RSI (Period = 2): Determines overbought and oversold situations for the price. Goes long when RSI falls below 5, goes short when RSI rises above 95.
-
CryptoBottom Indicator: Determines if the price has broken through the support level. Combined with fast RSI to generate high probability long signals.
According to the timing of price breaking through the channels and Bollinger bands to make trades, and going long or short based on overbought and oversold indications of RSI, the core trading logic of this strategy is formed.
Advantages of the Strategy
This strategy has the following advantages:
-
Dual-track system increases signal accuracy. Price channel judges major trends and Bollinger bands identify precise support and resistance levels. The combination enhances signal quality.
-
Fast RSI indicator captures reversal opportunities by detecting overbought and oversold. The RSI period is set to be 2 so it can quickly identity reversal nodes.
-
CryptoBottom speeds up confirmation of long signals. Breaking through support levels allows fast judgment of bottom characteristics and avoids missing long signals.
-
Reasonable parameter settings and easy to optimize. Simple and intuitive parameter combinations make it easy for parameter optimization.
Risks of the Strategy
There are also some risks for this strategy:
-
Improper parameter settings for Bollinger bands may miss significant price moves or generate false signals.
-
The interaction patterns between the dual tracks can be complex, requiring some technical sophistication for accurate judgments.
-
The risk of failed reversals still exists since the probability of price getting pulled back cannot be eliminated.
-
Difficulty in parameter optimization. The optimal parameters may become ineffective if market conditions change.
Optimization Directions
The strategy can be improved in the following aspects:
-
Optimize the parameters of Bollinger bands to make the upper and lower bands closer to the price, improving the accuracy of trade signals.
-
Add stop loss mechanisms to cut losses when they reach certain threshold percentages. This effectively controls risks.
-
Incorporate more indicators to determine trend, support and resistance levels to reduce false signals.
-
Introduce machine learning algorithms to auto-tune the parameters so that they can adapt to changing market environments.
Conclusion
This strategy integrates price channel, Bollinger bands and fast RSI indicator to construct a dual-track reversal trading system. While judging major trends, it also quickly seizes support, resistance and overbought/oversold opportunities. The parameter settings are simple and direct, easy to understand and optimize. It can effectively identify reversal chances and suits algorithmic trading.
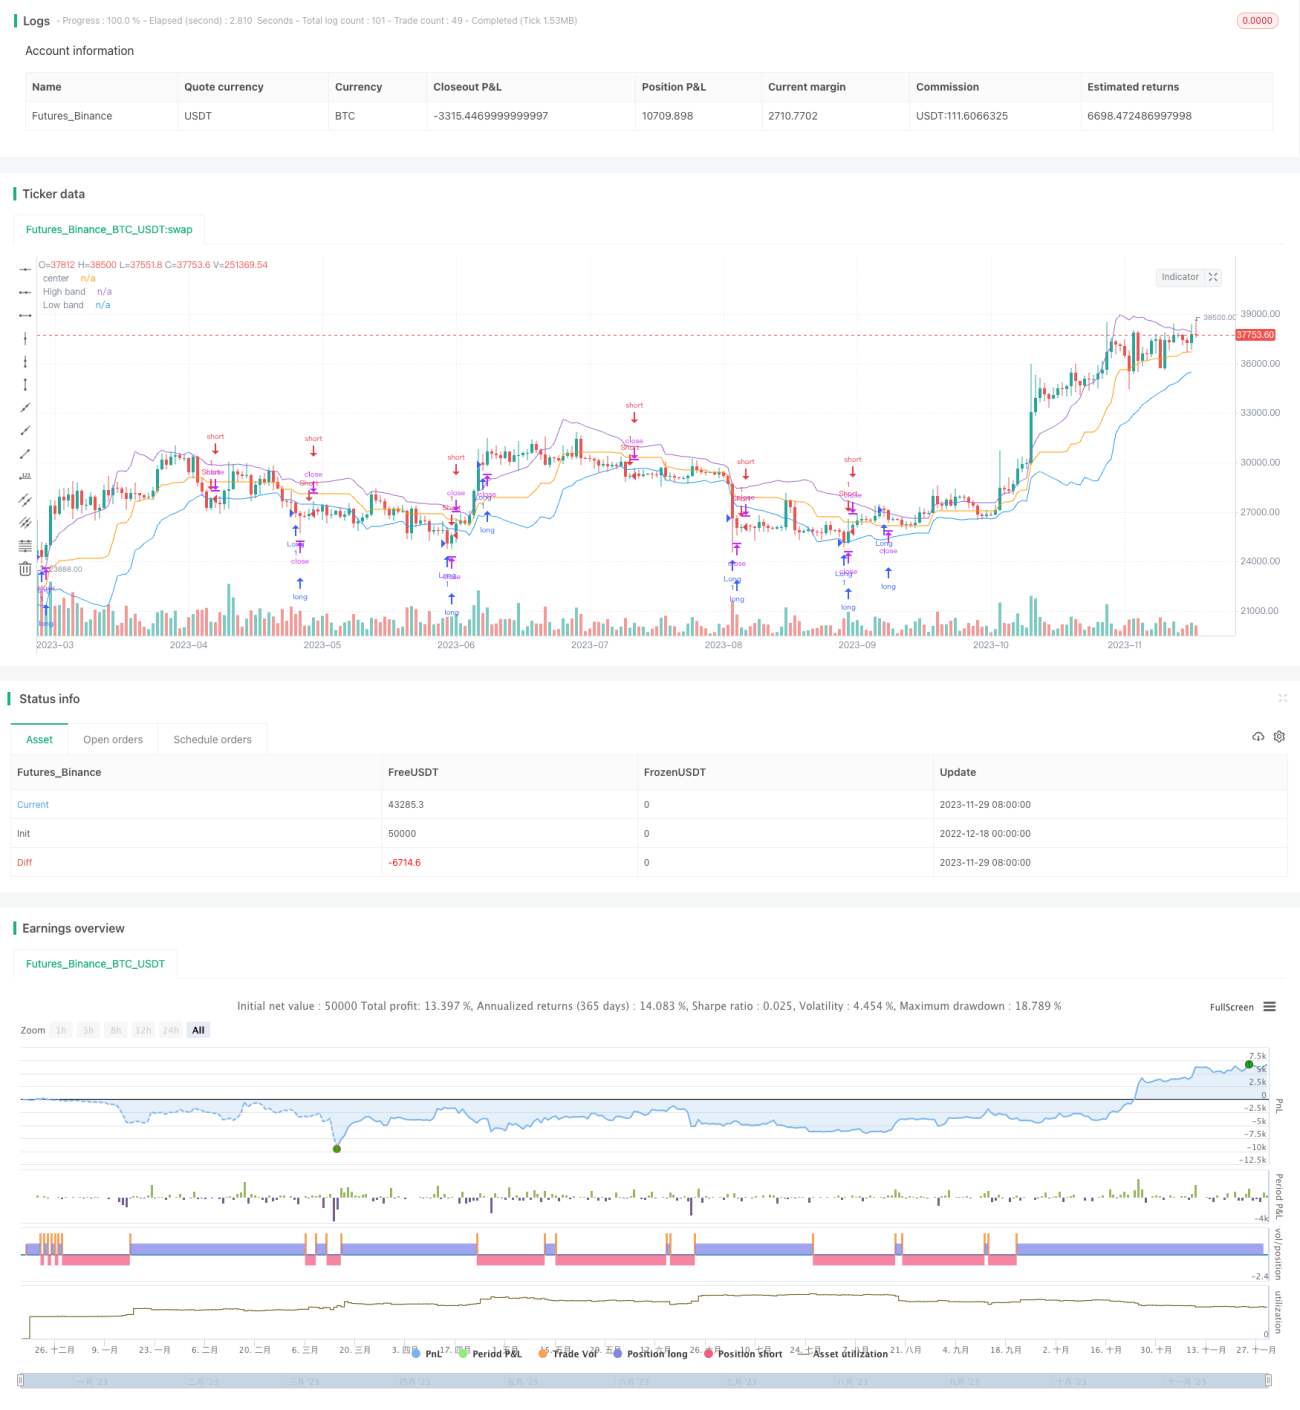
/*backtest
start: 2022-12-18 00:00:00
end: 2023-11-30 05:20:00
period: 1d
basePeriod: 1h
exchanges: [{"eid":"Futures_Binance","currency":"BTC_USDT"}]
*/


//@version=2
strategy("Noro's Bands Strategy v1.3", shorttitle = "NoroBands str 1.3", overlay=true, default_qty_type = strategy.percent_of_equity, default_qty_value=100.0, pyramiding=0)
- 1