概述
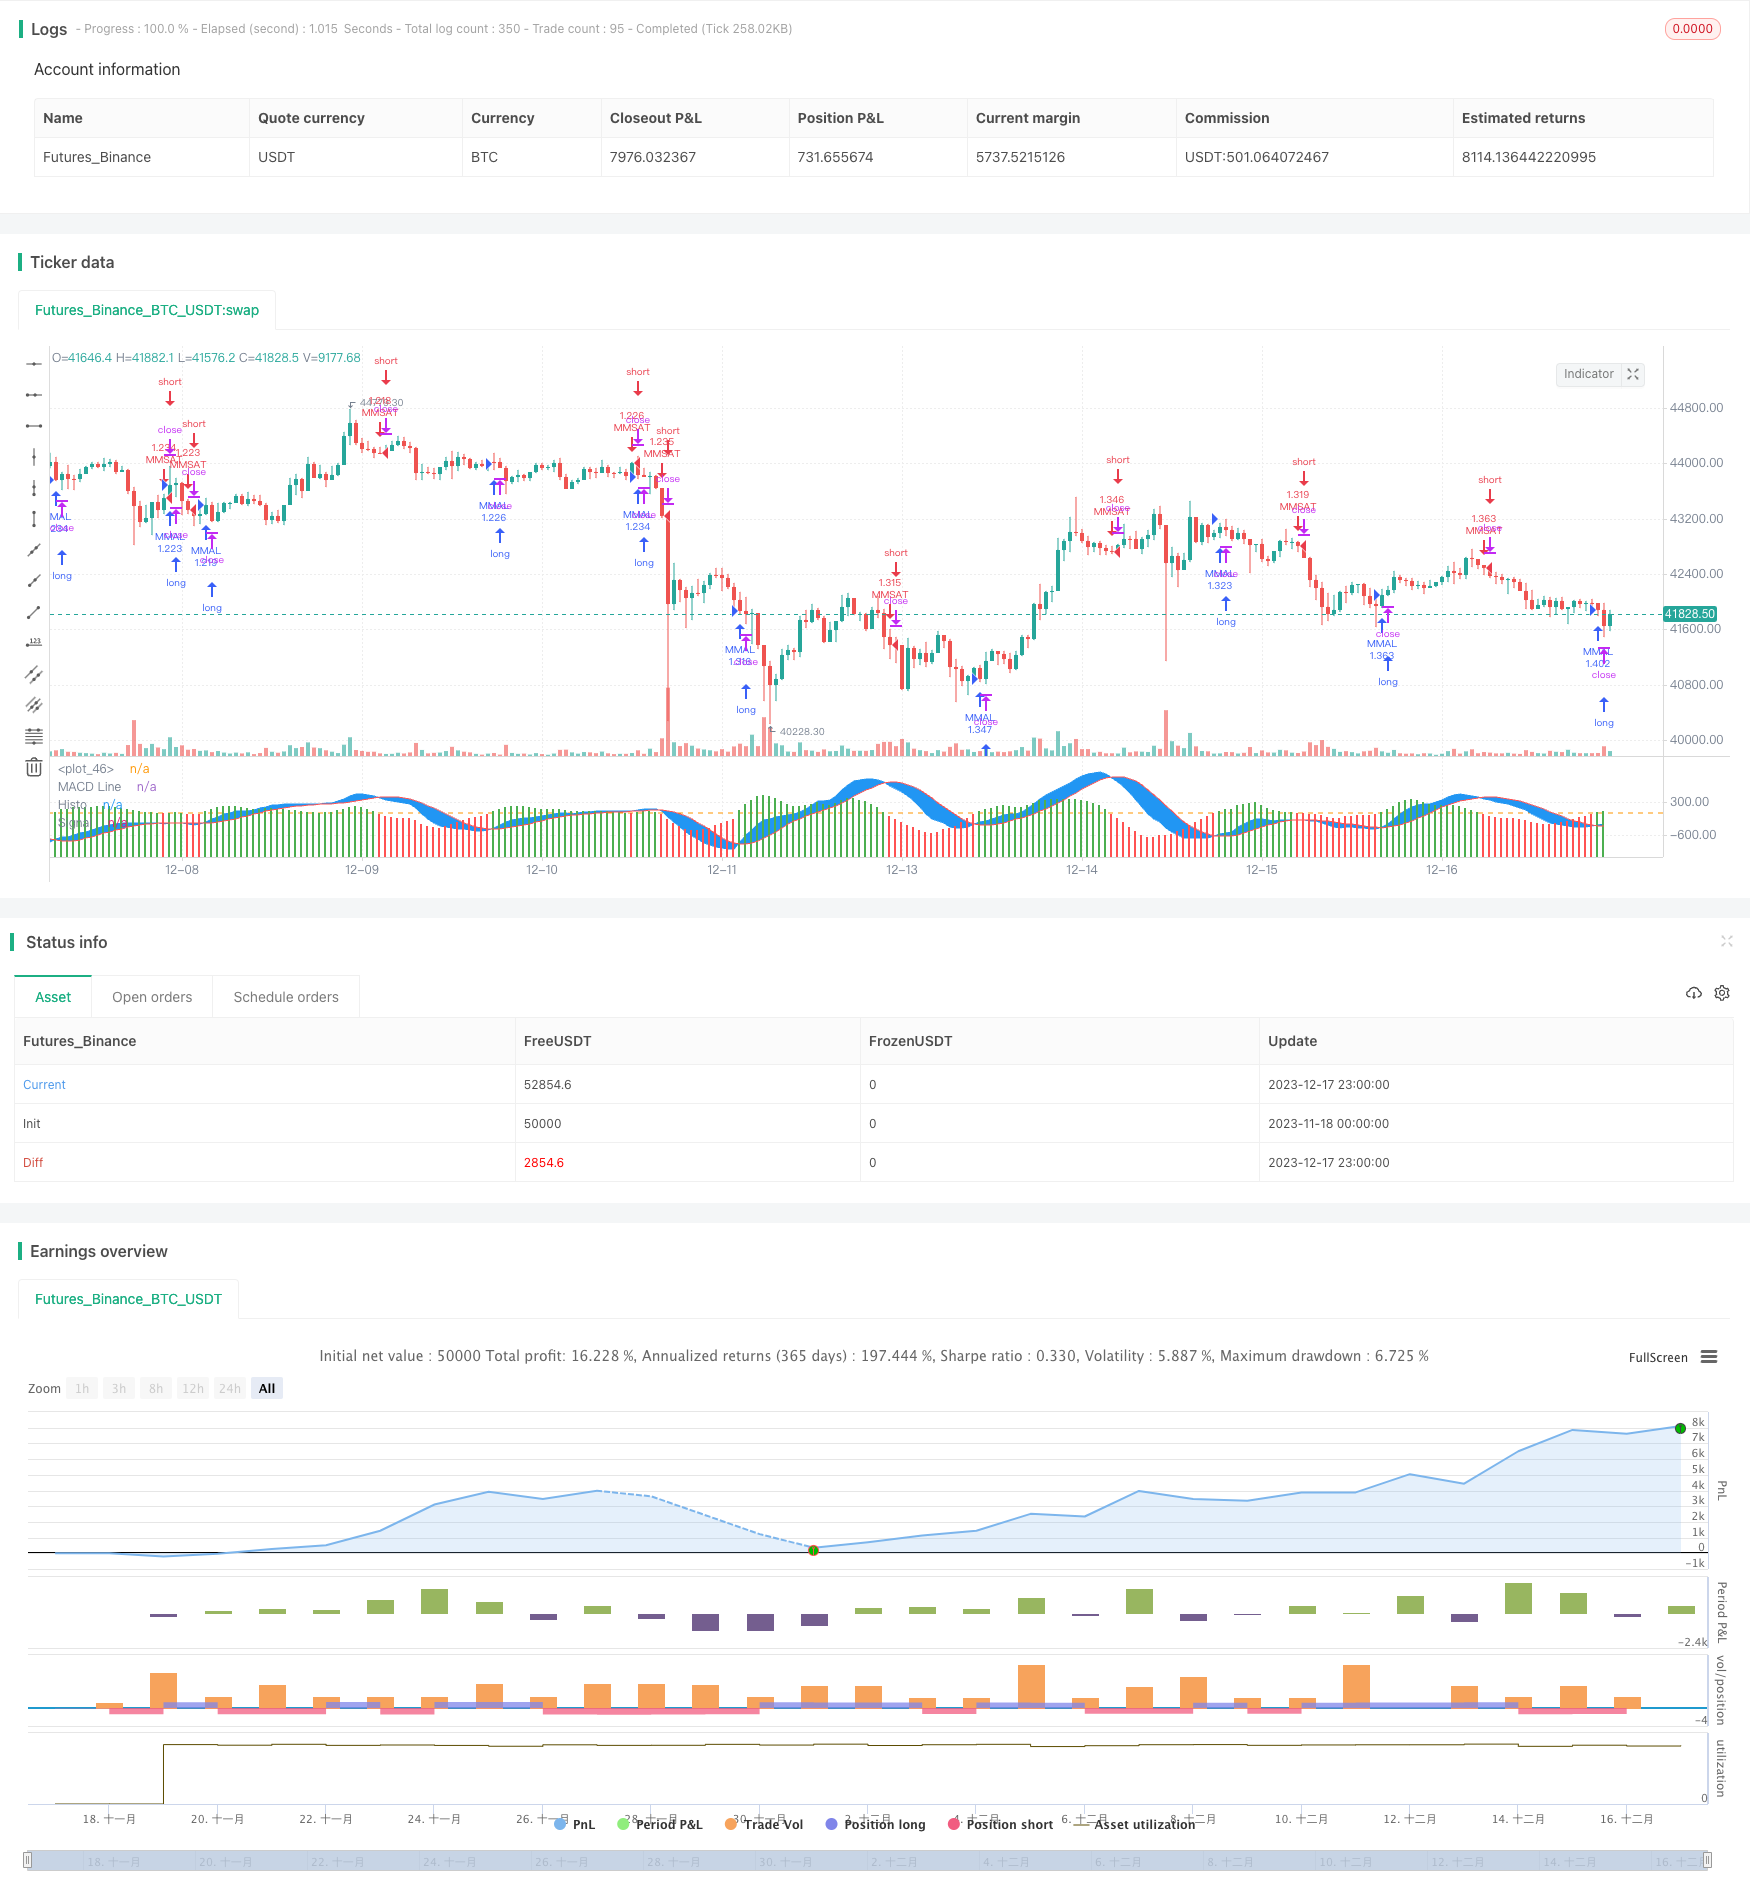
本策略通过计算Heikin-Ashi蜡烛线,平滑K线价格,结合MACD指标发出交易信号,实现追踪中长线趋势的量化交易策略。
策略原理
计算Heikin-Ashi开盘价、收盘价、最高价、最低价,绘制Heikin-Ashi蜡烛线,平滑K线价格走势。
设置MACD参数:快线长度12,慢线长度26,信号线长度9。
计算DEA慢线、DEA快线和MACD差值。绘制MACD柱状图。
当MACD差值上穿0时,做多;当MACD差值下穿0时,做空。
设置年、月、日过滤条件,只在指定时间段内交易。
优势分析
Heikin-Ashi蜡烛线可有效滤除市场噪音,识别趋势。
MACD可提供较为清晰的趋势买卖点。
结合Heikin-Ashi和MACD,可提高买卖点质量,增加获利 trades。
设置时间过滤条件,可根据历史数据回测确定最佳交易时段,提高盈利率。
风险分析
趋势反转时,可能出现较大亏损。
MACD参数设置不当,可产生过多无效信号。
时间过滤条件过于死板,可能漏掉较好交易机会。
对策:
设置止损止盈,控制单次亏损。
优化MACD参数,确定最佳参数组合。
结合其他指标判断局部趋势。
优化方向
测试不同的参数组合,寻找最优参数。
增加止损机制,如留出止损/追踪止损。
结合EMA、KDJ等指标判断反转点。
添加量能指标,避免量能 divergence。
总结
本策略通过计算Heikin-Ashi蜡烛线平滑价格,配合MACD Tradingview指标判断趋势方向和入场点位,实现了一个基于趋势跟踪的量化策略。相比普通MACD策略,它平滑了价格曲线,过滤了部分噪音,可以更清楚判断趋势方向。通过parameter优化、止损机制、和其它指标的组合,可以进一步增强策略的稳定性和盈利能力。
策略源码
/*backtest
start: 2023-11-18 00:00:00
end: 2023-12-18 00:00:00
period: 1h
basePeriod: 15m
exchanges: [{"eid":"Futures_Binance","currency":"BTC_USDT"}]
*/

//@version=4
strategy("MACD ASHI BARS .v1 ", overlay=false,default_qty_type = strategy.percent_of_equity, default_qty_value = 100,commission_type=strategy.commission.percent,commission_value=0.1,slippage=1)

// Calculation HA Values
haopen  = 0.0
haclose = (open + high + low + close) / 4
haopen := na(haopen[1]) ? (open + close) / 2 : (haopen[1] + haclose[1]) / 2
hahigh  = max(high, max(haopen, haclose))
halow   = min(low,  min(haopen, haclose))

// HA colors
hacolor = haclose > haopen ? color.green : color.red
src=haclose


fastmacd = input(12,title='MACD Fast  Line Length')
slowmacd = input(26,title='MACD Slow Line Length')
signalmacd = input(9,title='Signal Line Length')

macdslowline1 = sma(src,slowmacd)
macdslowline2 = sma(macdslowline1,slowmacd)
DEMAslow = ((2 * macdslowline1) - macdslowline2 )

macdfastline1 = sma(src,fastmacd)
macdfastline2 = sma(macdfastline1,fastmacd)
DEMAfast = ((2 * macdfastline1) - macdfastline2)

MACDLine = (DEMAfast - DEMAslow)

SignalLine = sma(MACDLine, signalmacd)

delta = MACDLine-SignalLine


swap1 = delta>0?color.green:color.red


plot(delta,color=swap1,style=plot.style_columns,title='Histo',histbase=0,transp=20)
p1 = plot(MACDLine,color=color.blue,title='MACD Line')
p2 = plot(SignalLine,color=color.red,title='Signal')
fill(p1, p2, color=color.blue)
hline(0)


yearfrom = input(2020)
yearuntil =input(2042)
monthfrom =input(1)
monthuntil =input(12)
dayfrom=input(1)
dayuntil=input(31)


if ( crossover(delta,0)  and   year >= yearfrom and year <= yearuntil and month>=monthfrom and month <=monthuntil and dayofmonth>=dayfrom and dayofmonth < dayuntil)
    strategy.entry("MMAL", strategy.long, stop=close, oca_name="TREND",  comment="AL")

else
    strategy.cancel(id="MMAL")


if (  crossunder(delta,0) and  year >= yearfrom and year <= yearuntil and month>=monthfrom and month <=monthuntil and dayofmonth>=dayfrom and dayofmonth < dayuntil )

    strategy.entry("MMSAT", strategy.short,stop=close, oca_name="TREND",  comment="SAT")
else
    strategy.cancel(id="MMSAT")