Bollinger Band Short-term Reversion Quantitative Strategy Based on Moving Average

Overview
This strategy is a short-term reversal trading strategy based on the Bollinger Band indicator. It combines moving averages, standard deviations and Bollinger bands to look for opportunities for reversal trading when prices are abnormally dispersed.
Strategy Principle
-
Calculate moving average and standard deviation. Use sma() function to calculate sma moving average and stdev() function to calculate standard deviation.
-
Calculate upper and lower rail of Bollinger band according to moving average and standard deviation. The upper rail is price+standard deviation1 and the lower rail is price-standard deviation1.
-
When the price breaks through the upper or lower rail, it indicates that the price is abnormal. At this time, we determine to do reverse trading.
-
Specifically, if the price is lower than the lower rail, we go long; if the price is higher than the upper rail, we go short.
Advantage Analysis
-
Use Bollinger band channel to judge abnormal prices, which provides basis for reverse trading.
-
Combined with the moving average factor, some noisy trades can be effectively filtered out.
-
The introduction of standard deviation factor makes the Bollinger band channel more dynamic to better judge abnormal prices.
-
This strategy has relatively small drawdowns and certain stability.
Risk Analysis
-
The Bollinger Band indicator cannot completely determine the abnormal situation of prices. There may be false breakouts.
-
The trading frequency may be too high. It is recommended to adjust the parameters appropriately to control the trading frequency.
-
The breakout signals of the upper and lower Bollinger bands may last for a long time. Appropriate adjustment of parameters is needed to obtain better reversal effects.
-
Introduce stop loss appropriately to control risks.
Optimization Directions
-
Optimize the moving average cycle and standard deviation parameters to obtain a more reasonable Bollinger band channel.
-
Increase auxiliary factors such as EMA and MACD to filter some signals.
-
Introduce stop loss and position control mechanisms.
-
Optimize position size and position control measures.
Summary
This strategy judges abnormal prices through the Bollinger Band indicator and makes reversal trades with moving averages and standard deviation parameters. It has certain stability. We need to further reduce the maximum drawdown of the strategy and improve stability through means such as parameter optimization, introduction of auxiliary factors, stop loss management and position control.
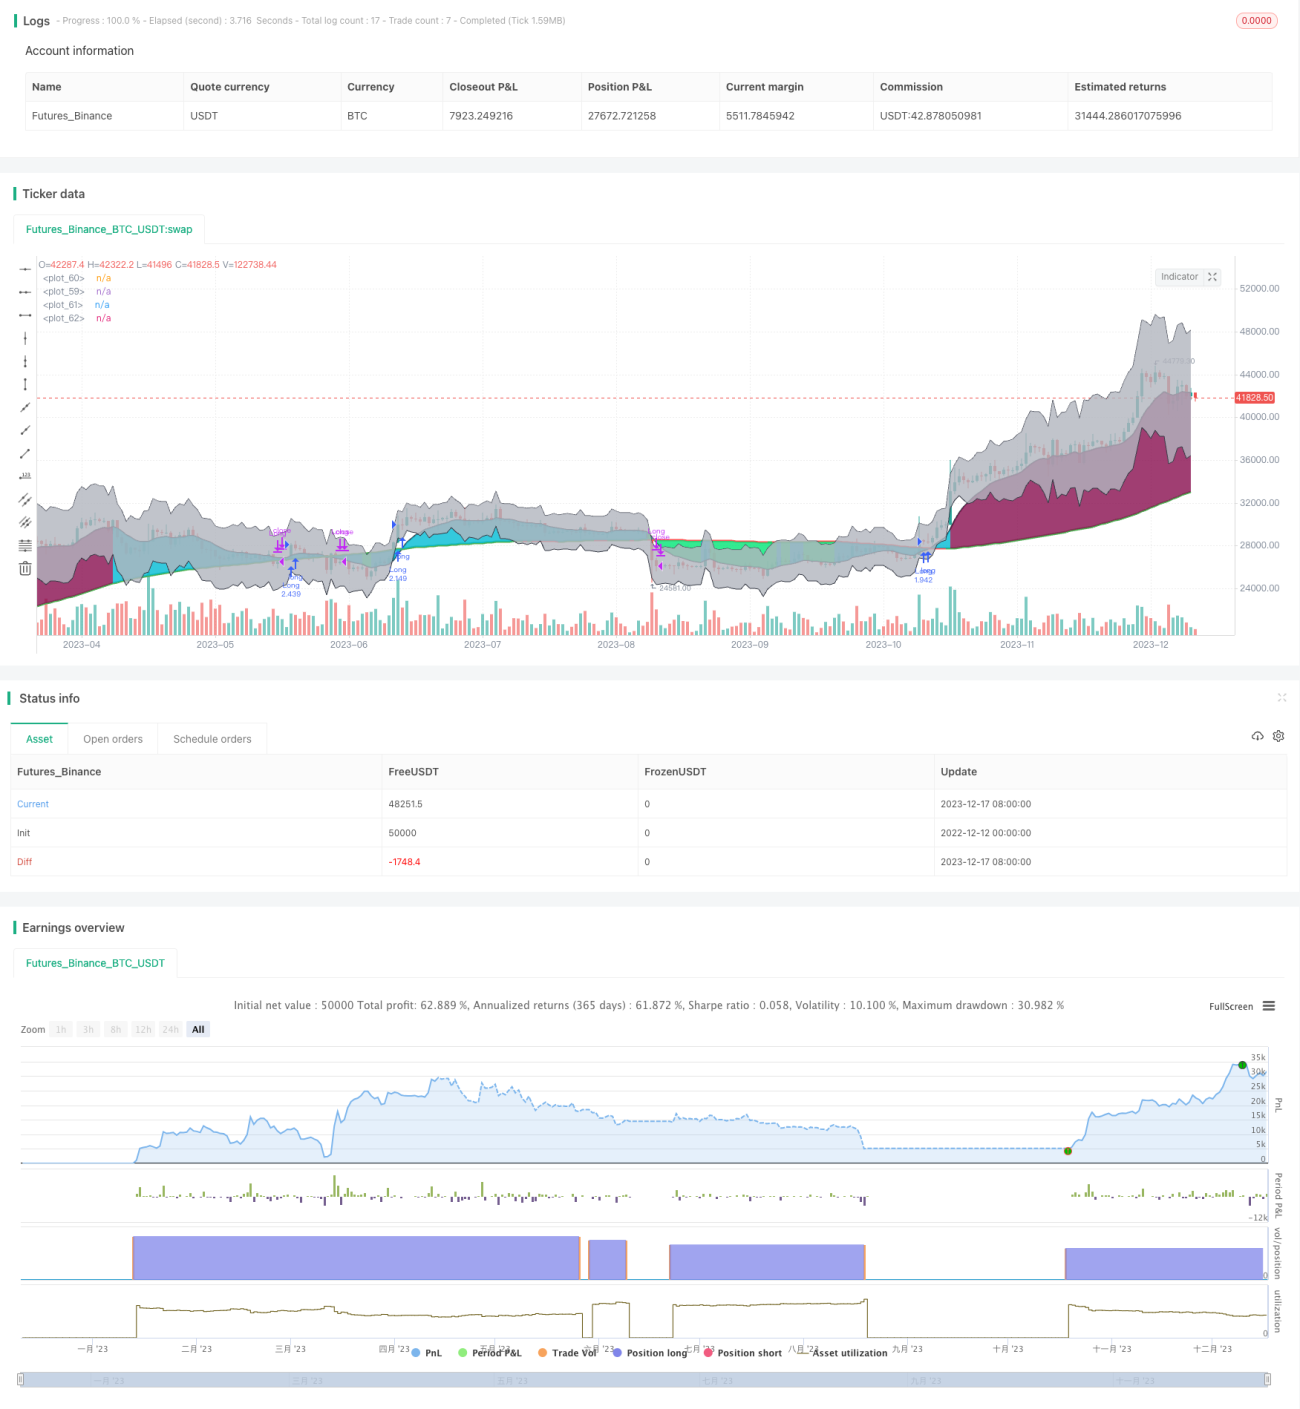
/*backtest
start: 2022-12-12 00:00:00
end: 2023-12-18 00:00:00
period: 1d
basePeriod: 1h
exchanges: [{"eid":"Futures_Binance","currency":"BTC_USDT"}]
*/

//@version=3
strategy("BCE Version of EMA, SMA Mean Reversion", overlay=true, default_qty_type=strategy.percent_of_equity, default_qty_value=100)

// Inputs- 1