Bollinger Bands Momentum Breakout Strategy

Overview
The Bollinger Bands momentum breakout strategy is a typical quantitative trading strategy that utilizes the Bollinger Bands indicator to identify mispriced stocks. This strategy uses the upper and lower bands of Bollinger Bands to judge whether a stock is overvalued or undervalued, and combines the moving average of the stock price to generate trading signals. When the price breaks through the upper band, the stock is considered undervalued and a buy signal is formed. When the price breaks through the lower band, the stock is considered overvalued and a sell signal is formed.
Principle
The Bollinger Bands consist of a middle band, an upper band and a lower band. The middle band is the n-day simple moving average; the upper and lower bands are respectively two standard deviations above and below the middle band. When the stock price is close to the upper band, it is considered overvalued, and when it is close to the lower band, it is considered undervalued.
This strategy first calculates the 20-day middle, upper and lower Bollinger Bands. Then it judges whether the stock price is higher or lower than the middle band. If it is higher than the middle band, a buy signal is formed. If it is lower than the middle band, a sell signal is formed. At the same time, if the stock price breaks through the upper band, it serves as a closing signal, and if the price breaks through the lower band, it also serves as a closing signal.
Advantages
The biggest advantage of this strategy is that it uses Bollinger Bands to judge the overvaluation and undervaluation of stock prices, avoiding the problem of blind trading. When the stock price is overvalued, the strategy will issue a sell signal. When the stock price is undervalued, the strategy will issue a buy signal. This can effectively filter out some noise and the quality of trading signals entered is higher.
In addition, the moving average is used as an auxiliary judgment indicator in this strategy. The actual breakthrough of the moving average by the stock price is also a strong trend signal. Combined with Bollinger Band's judgment of overvaluation and undervaluation, the strategy signals can be more accurate.
Risks
The biggest risk of this strategy lies in the Bollinger Bands indicator itself. When the stock price fluctuates abnormally, the range of Bollinger Bands will also change accordingly. At this time, there may be situations where the stock price is clearly overvalued or undervalued, but has not reached the upper or lower rails of the Bollinger Bands. As a result, the strategy fails to give trading signals.
In addition, relying solely on technical indicators without considering the fundamentals of the stock also poses some risks. For example, stocks with declining profits but undervalued prices, or stocks with high-speed earnings growth but relatively high prices. In these cases, there may be some deviation between strategy signals and actual stock value.
Optimization Directions
This strategy can be optimized in the following aspects:
-
Add a stop loss mechanism. When the stock price decreases by a certain percentage compared to the purchase price, forced stop loss exit. This can effectively control the maximum loss of the strategy.
-
Combine fundamentals with technical indicators. Add judgment rules such as PE and PB ratios to avoid buying stocks that are already overvalued.
-
Dynamically adjust parameters. Make parameters of Bollinger Bands such as cycle length and standard deviation multiplier adjust dynamically according to volatility of different stocks. This allows Bollinger Bands to better adapt to stock price fluctuations.
Conclusion
The Bollinger Bands momentum breakout strategy avoids the risk of blind trading by issuing trading signals with auxiliary judgment indicators, which can effectively filter out noise signals. At the same time, there are certain limitations that cannot completely avoid the impact of abnormal fluctuations. In the future, optimization can be carried out in aspects such as stop loss, combining fundamentals, and dynamically adjusting parameters to make the strategy more stable and reliable.
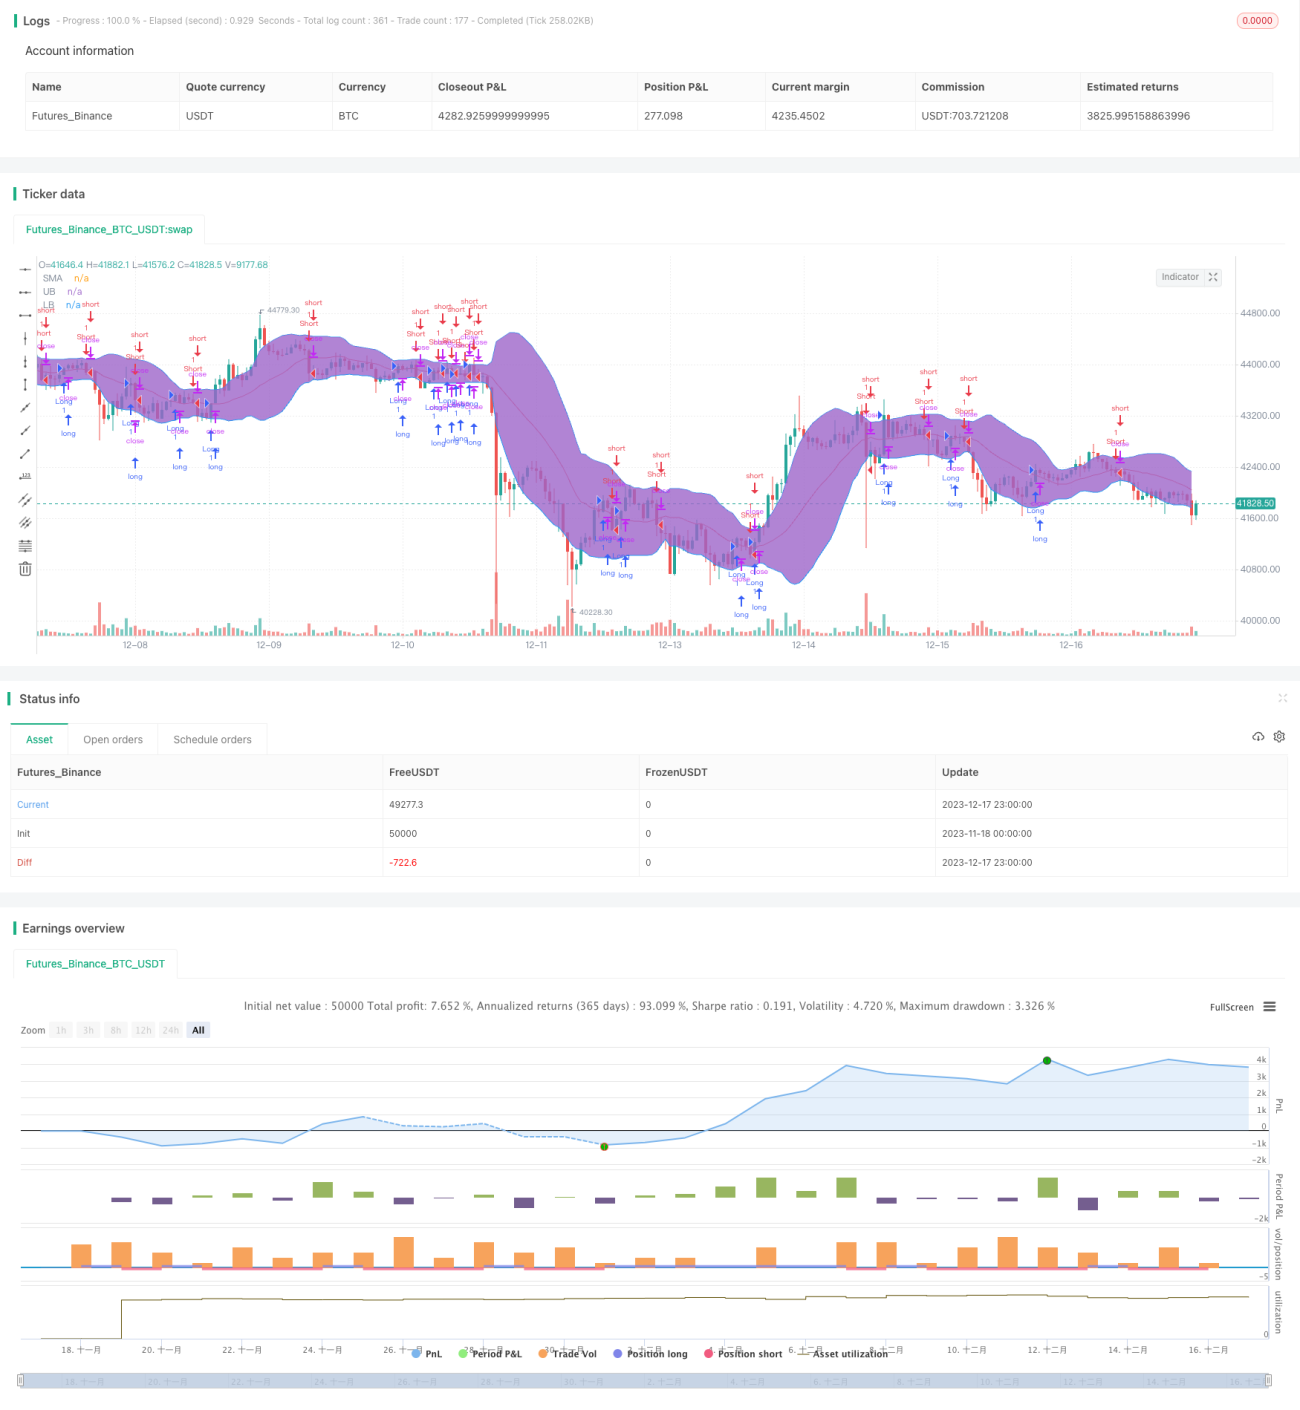
/*backtest
start: 2023-11-18 00:00:00
end: 2023-12-18 00:00:00
period: 1h
basePeriod: 15m
exchanges: [{"eid":"Futures_Binance","currency":"BTC_USDT"}]
*/

//@version=4
strategy(title="NoScoobies Bollinger Bands", overlay=true)
source = close
length = input(20, minval=1, title = "Period") //Length of the Bollinger Band - 1