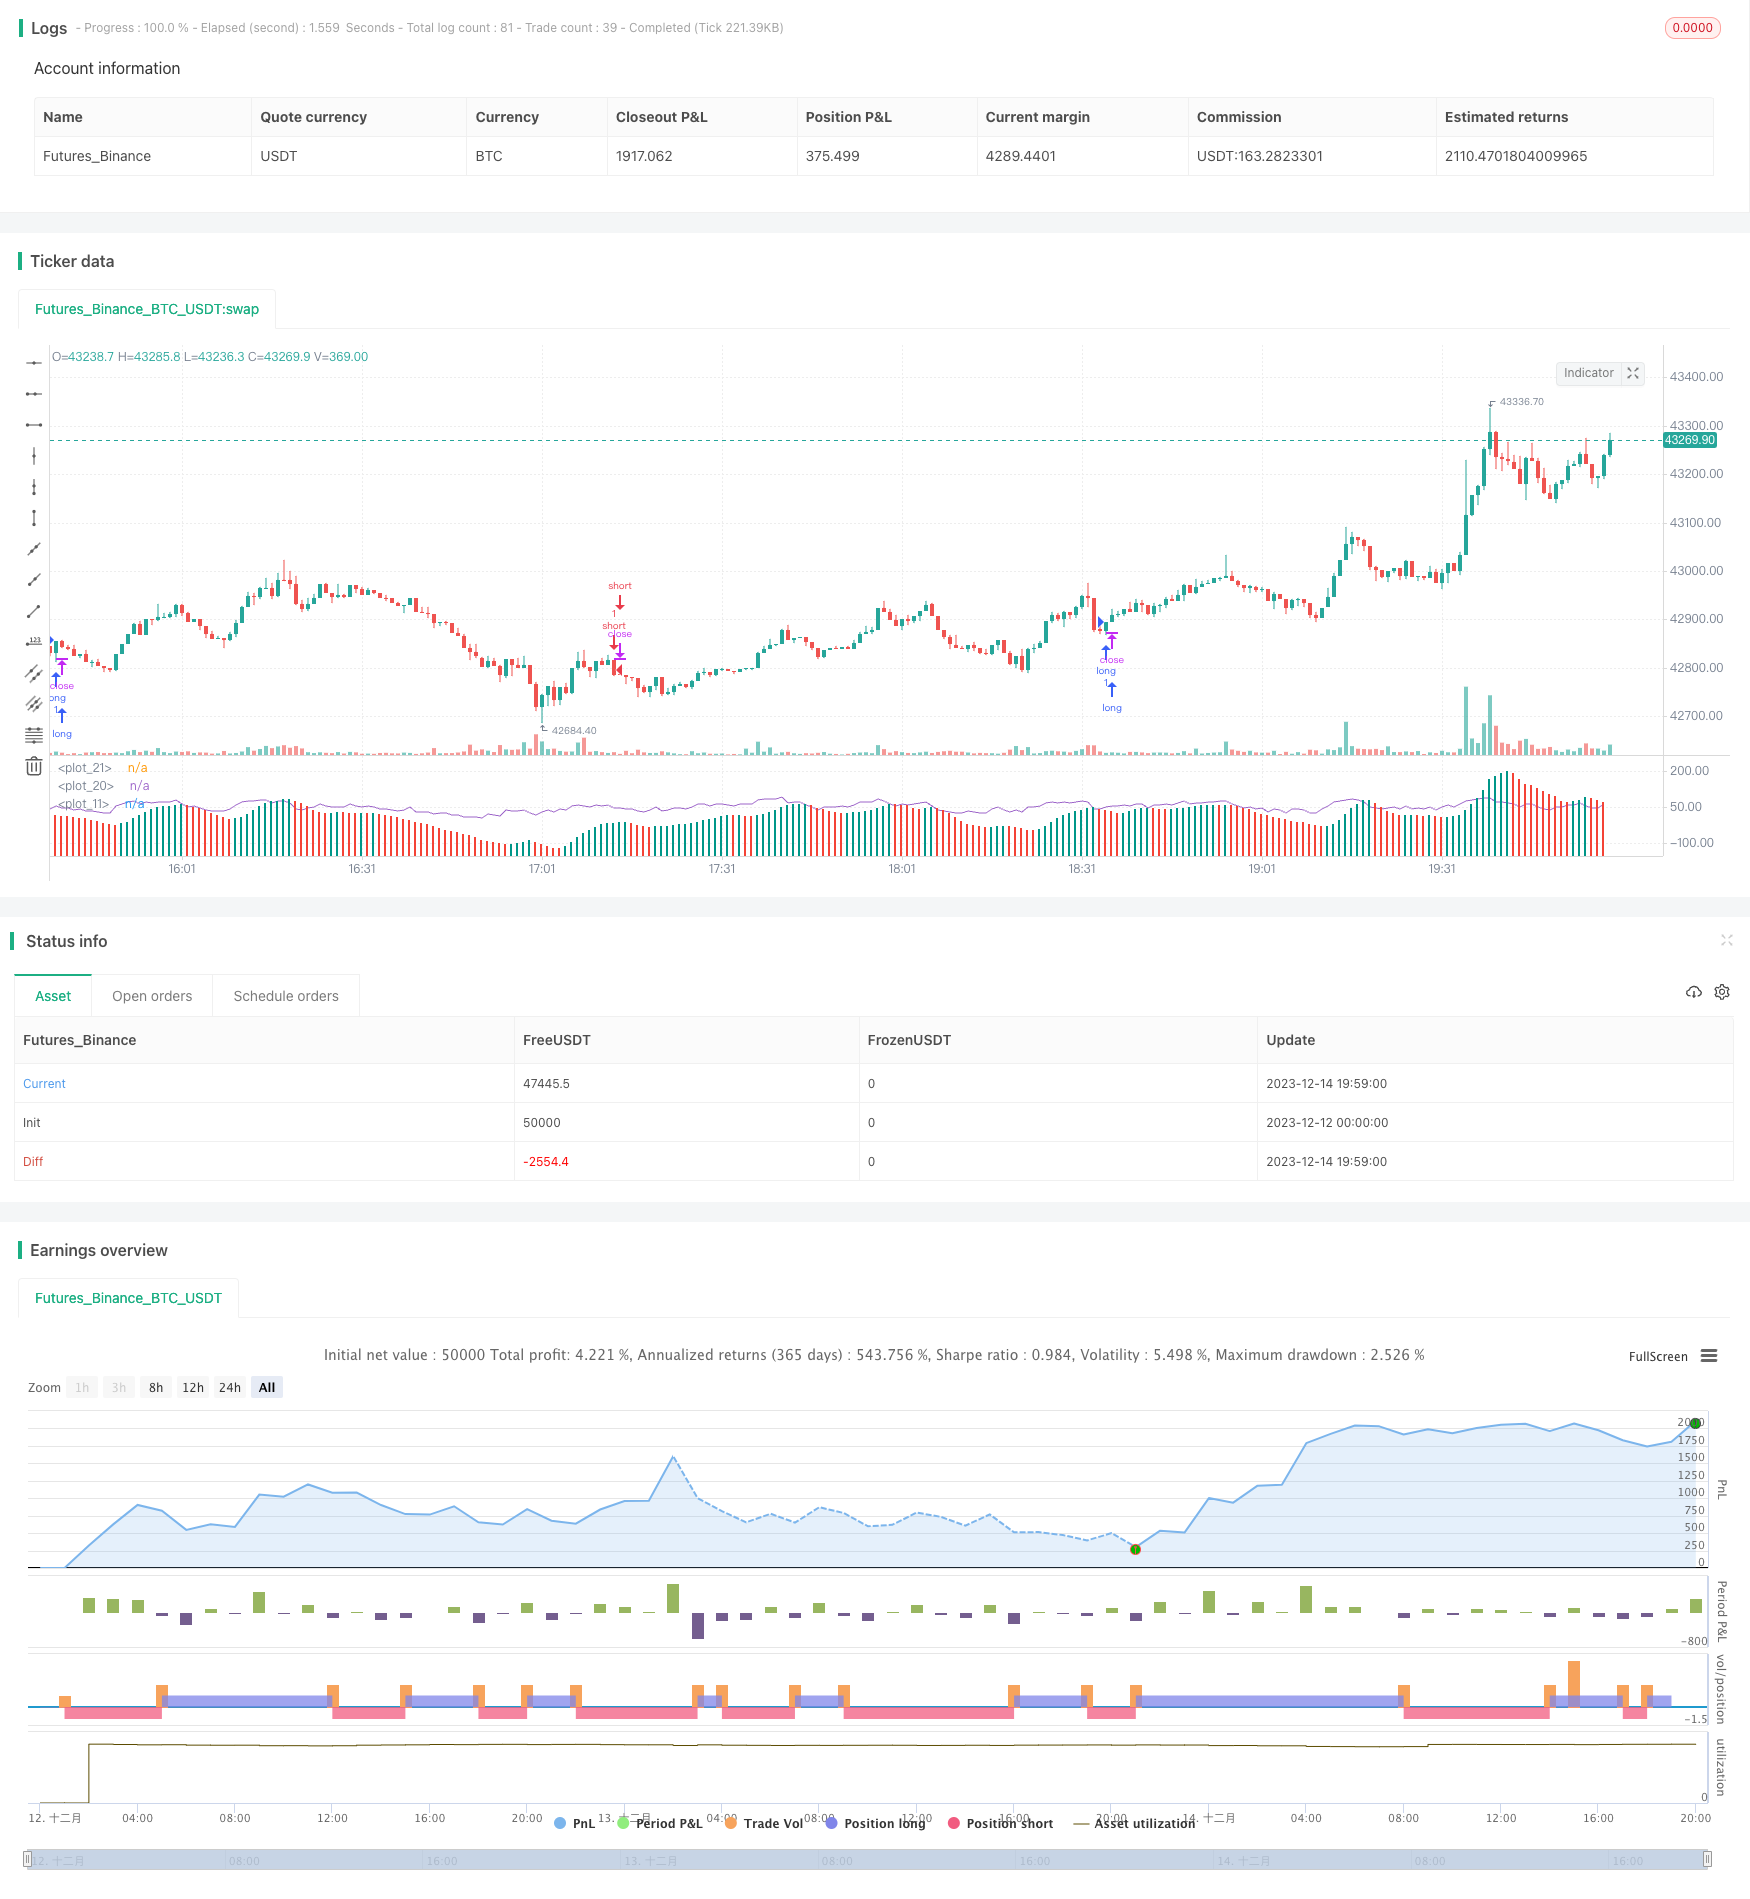
概述
本策略通过Awesome Oscillator(AO)指标判断趋势方向,并结合移动平均线进行趋势确认,属于趋势跟踪策略。当AO指标上穿0轴线并且快速线上穿慢速线时做多,当AO指标下穿0轴线并且快速线下穿慢速线时做空,利用趋势的方向性来获利。
策略原理
本策略主要基于AO指标来判断趋势方向。AO指标是根据}-{线的中点和5周期、34周期的简单移动平均线的差计算得到的,属于 Momentum 类别指标。当 AO 指标为正时,代表着短期移动平均线高于长期移动平均线,Should be interpreted as a bullish sign. 反之当 AO 为负时,代表着短期移动平均线低于长期移动平均线,Should be interpreted as a bearish sign。
所以,AO 指标可以有效地判断趋势的方向。当 AO 上穿 0 轴线时,代表着市场趋势转为看涨,应该做多;当 AO 下穿 0 轴线时,代表着市场趋势转为看跌,应该做空。
另外,本策略还加入了 20 周期和 200 周期的移动平均线。这两个均线的角度代表着中长期趋势的方向。仅仅依靠 AO 指标来判断短期趋势方向还不够,还需要中长期趋势的确认,所以加入了移动平均线的判断。
当快速均线上穿慢速均线,中长期趋势转为看涨时,我们在 AO 上穿 0 轴线的时候做多,随着趋势走高来获利;当快速均线下穿慢速均线,中长期趋势转为看跌时,我们在 AO 下穿 0 轴线的时候做空,随着趋势走低获利。
策略优势
- 利用 AO 指标判断短期趋势方向,准确率较高
- 加入移动平均线判断中长期趋势,可以有效过滤假突破
- 获利快,适合短线操作
风险分析
- AO 指标下穿 0 轴线和移动平均线发出做空信号时,价格可能继续上涨一段时间才转头向下,存在antry的风险
- AO 指标上穿 0 轴线和移动平均线发出做多信号时,价格可能继续下跌一段时间才转头向上,存在antry的风险
- 大级别边际效应的风险。在市场突破重要的技术位置后,AO 指标可能发生错乱,从而产生错误信号
优化方向
- 可以测试不同参数的移动平均线组合,如 10 周期和 50 周期,寻找更匹配的均线
- 可以加入其他指标进行组合,如 RSI 指标,使信号更加可靠
- 可以优化固定止损比例,让策略的风险收益比更好
总结
本策略属于简单的趋势跟踪策略,通过 AO 指标判断短期趋势且中长期趋势确认的思路是正确的。AO 指标和移动平均线的组合使用广泛,较为成熟,本策略也具有很强的可靠性。通过进一步参数优化和组合指标优化,可以使本策略的效果更加出色。
策略源码
/*backtest
start: 2023-12-12 00:00:00
end: 2023-12-14 20:00:00
period: 1m
basePeriod: 1m
exchanges: [{"eid":"Futures_Binance","currency":"BTC_USDT"}]
*/

// https://www.youtube.com/watch?v=zr3AVwjCtDA

//@version=5
strategy(title="Bingx ESTRATEGIA de Trading en 1 minuto ", shorttitle="AO")
long = input.bool(true, "long")
short = input.bool(true, "short")
profit = (input.float(10, "profit") / 100) + 1
stop = (input.float(5, "stop") / 100) + 1
ao = ta.sma(hl2,5) - ta.sma(hl2,34)
diff = ao - ao[1]
plot(ao, color = diff <= 0 ? #F44336 : #009688, style=plot.style_columns)
changeToGreen = ta.crossover(diff, 0)
changeToRed = ta.crossunder(diff, 0)
alertcondition(changeToGreen, title = "AO color changed to green", message = "Awesome Oscillator's color has changed to green")
alertcondition(changeToRed, title = "AO color changed to red", message = "Awesome Oscillator's color has changed to red")

ema20 = ta.ema(close, 20)
ema200 = ta.ema(close, 200)
rsi = ta.rsi(close, 7)
plot(rsi)
plot(0, color=color.white)
var float pentry = 0.0
var float lentry = 0.0
var bool oab = false
// oab := ta.crossover(ao, 0) ? true : ta.crossover(0, ao) ? false : oab[1]

if long and close > open and ta.crossover(close, ema20) and ema20 > ema200 and ao > 0 and rsi > 50
    strategy.entry("long", strategy.long)
    pentry := close
strategy.exit("exit long", "long", limit=pentry * profit, stop=pentry / stop)

if short and close < open and ta.crossunder(close, ema20) and ema20 < ema200 and ao < 0 and rsi < 50
    strategy.entry("short", strategy.short)
    lentry := close
strategy.exit("exit short", "short", limit=lentry / profit, stop=lentry * stop)