Ichimoku Kinko Hyo Based BTC Trading Strategy

Overview
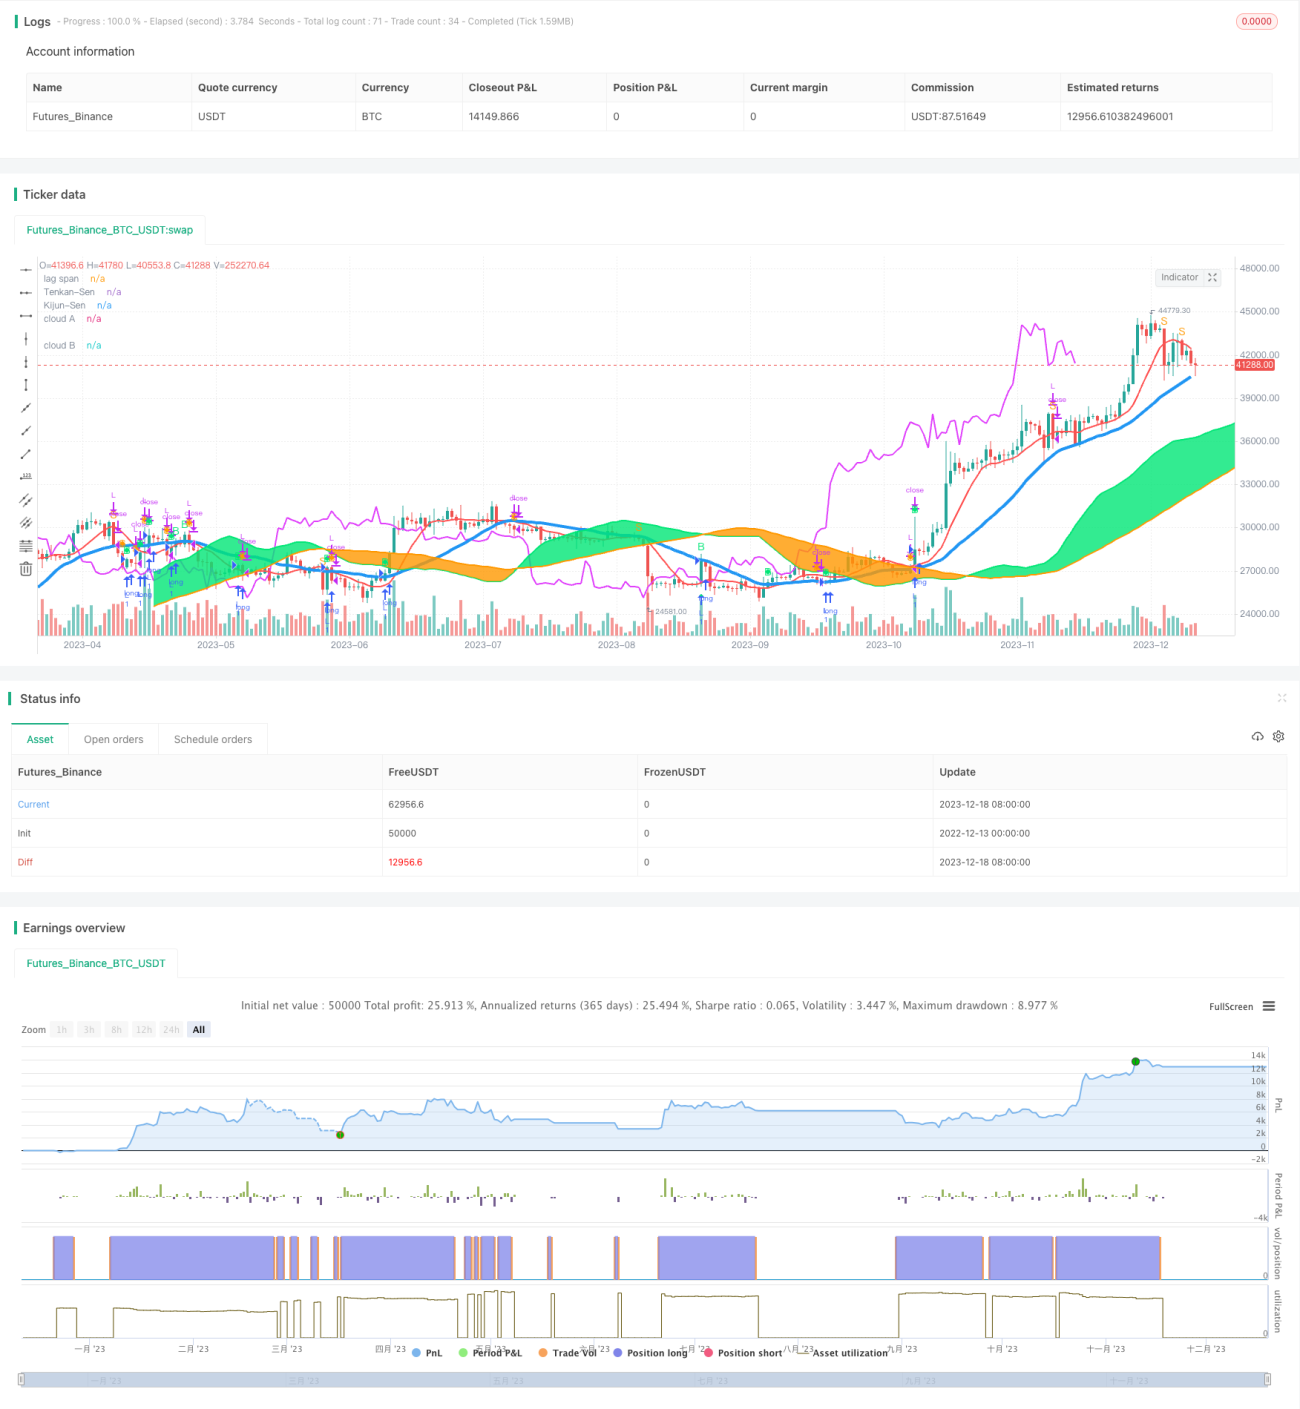
This strategy is called "Ichimoku Kinko Hyo Strategy". It is a BTC trading strategy based on Ichimoku Kinko Hyo system combined with other technical indicators.
Strategy Logic
The strategy is mainly based on Ichimoku Kinko Hyo system, which incorporates multiple technical indicators for trend trading. The main components are:
Kijun Sen: Represents market trend direction. It's the midpoint of highest and lowest price over past 26 days, acts as support and resistance lines. Buy and sell signals are generated when close price crosses Kijun Sen.
Tenkan Sen: Represents momentum of the price. It's the midpoint of highest and lowest price over past 9 days, helps determine best entry and exit spots.
Senkou Span A: Represents Ichimoku's mid-term line. It's the average of Kijun Sen and Tenkan Sen, acts as Ichimoku's warning line.
Senkou Span B: Represents long term trend line. It's the midpoint of past 52 days. Forms the Ichimoku cloud to determine long and short term trends.
In addition, the strategy also incorporates the RSI indicator to generate trading signals in overbought and oversold zones.
Buy signals are generated when close price breaks above Kijun Sen and locates above the cloud. Sell signals are generated when close price breaks below Kijun Sen and locates below the cloud.
Advantages
-
Ichimoku system accurately determines trends with relatively high winning rate.
-
Incorporation of multiple indicators avoids missing opportunities.
-
RSI effectively determines reversal spots.
-
Cloud intuitively presents long and short term trends.
Risk Analysis
-
Ichimoku system has certain lagging, needs incorporation of other indicators.
-
Works very well in trending markets but modestly in ranging markets.
-
RSI parameters need adjustments based on markets.
-
Cloud construction is complex which requires adept manipulation.
Parameters of Ichimoku can be optimized or more indicators can be added.
Optimization Directions
-
Optimize parameters of Ichimoku to determine trends quicker.
-
Add more indicators like moving averages to improve signal accuracy.
-
Adjust RSI parameter based on different markets.
-
Consider adding stop loss mechanisms to control risks.
Conclusion
Ichimoku combined with indicators like RSI has high accuracy in capturing upside trends. Lagging of Ichimoku and inadaptability in ranging markets are major risks. Proper parameter tuning and adding more indicators can mitigate these risks substantially, making the strategy more solid and reliable.
/*backtest
start: 2022-12-13 00:00:00
end: 2023-12-19 00:00:00
period: 1d
basePeriod: 1h
exchanges: [{"eid":"Futures_Binance","currency":"BTC_USDT"}]
*/

//@version=3
strategy("My Ichimoku Strat v2", overlay=true,default_qty_type=strategy.fixed, default_qty_value=1, initial_capital=1000, currency=currency.EUR,commission_type=strategy.commission.percent,commission_value=0.05)
// === BACKTEST RANGE ===
FromMonth = input(defval = 3, title = "From Month", minval = 1)- 1