Dual-Tracking Turtle Trading Strategy

Overview
This strategy utilizes two tracking stop loss points based on the turtle trading rules to limit losses, while setting different parameters to filter out market noise and enter on more pronounced trends.
Strategy Logic
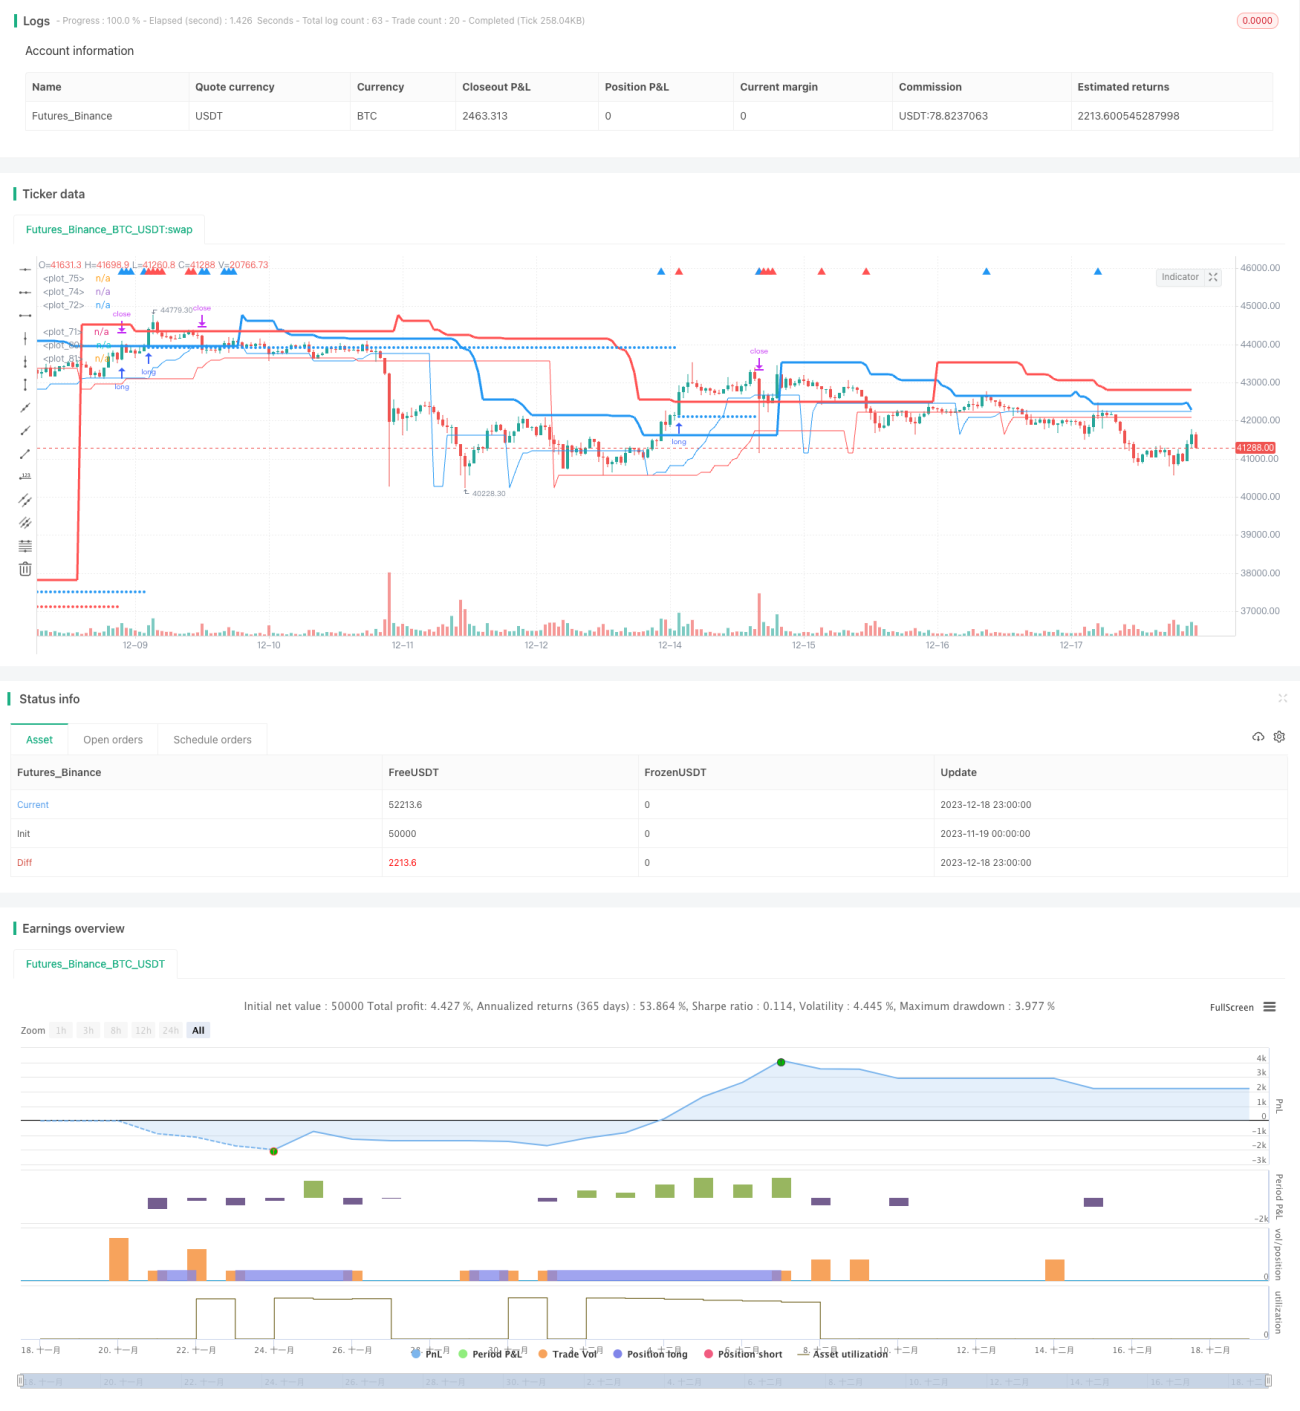
The strategy primarily relies on two tracking stop loss points, long_1 and long_2, to determine entry signals. Long_1 tracks the longer term trend while long_2 tracks the shorter term. Profit1 and profit2 act as the stop loss points.
If price is above long_1, the market is in a longer term uptrend. If price then drops below long_2, it indicates a short term pullback providing good entry opportunity to go long. If price is below long_1, there is no confirmed longer term trend. But if price then surpasses long_2, it signals a short term bounce and can also take long position.
After entering, two tracking stop losses stoploss1 and stoploss2 are set and compared with profit1 and profit2 to take the maximum value, in order to lock in profits.
Advantage Analysis
- Dual tracking stop loss effectively controls risks and locks in profits
- Combining both long term and short term indicators filters out some noise and enters on more pronounced trends
- Flexibility to adjust conservatism of strategy by tuning parameters
Risk Analysis
- Strategy is conservative and could miss some opportunities
- Improper stop loss setting may prematurely exit
- Less trades so single losing trade impact could be big
Can make strategy more aggressive by adjusting long and profit parameters for more trades. Also optimize stop loss algorithms for adaptive adjustments.
Optimization Directions
- Find optimal parameter combinations for long and profit
- Experiment with zigzag or shadow stop losses to reduce unnecessary stops
- Add more entry filters to detect stronger established trends
- Incorporate volume indicators to catch true breakouts
Summary
This is an overall conservative strategy suited for investors seeking steady growth. By tuning parameters and optimizing stop loss algorithms, aggression can be increased. Adding mechanisms to filter out market noise is also a direction for further optimizations.
- 1