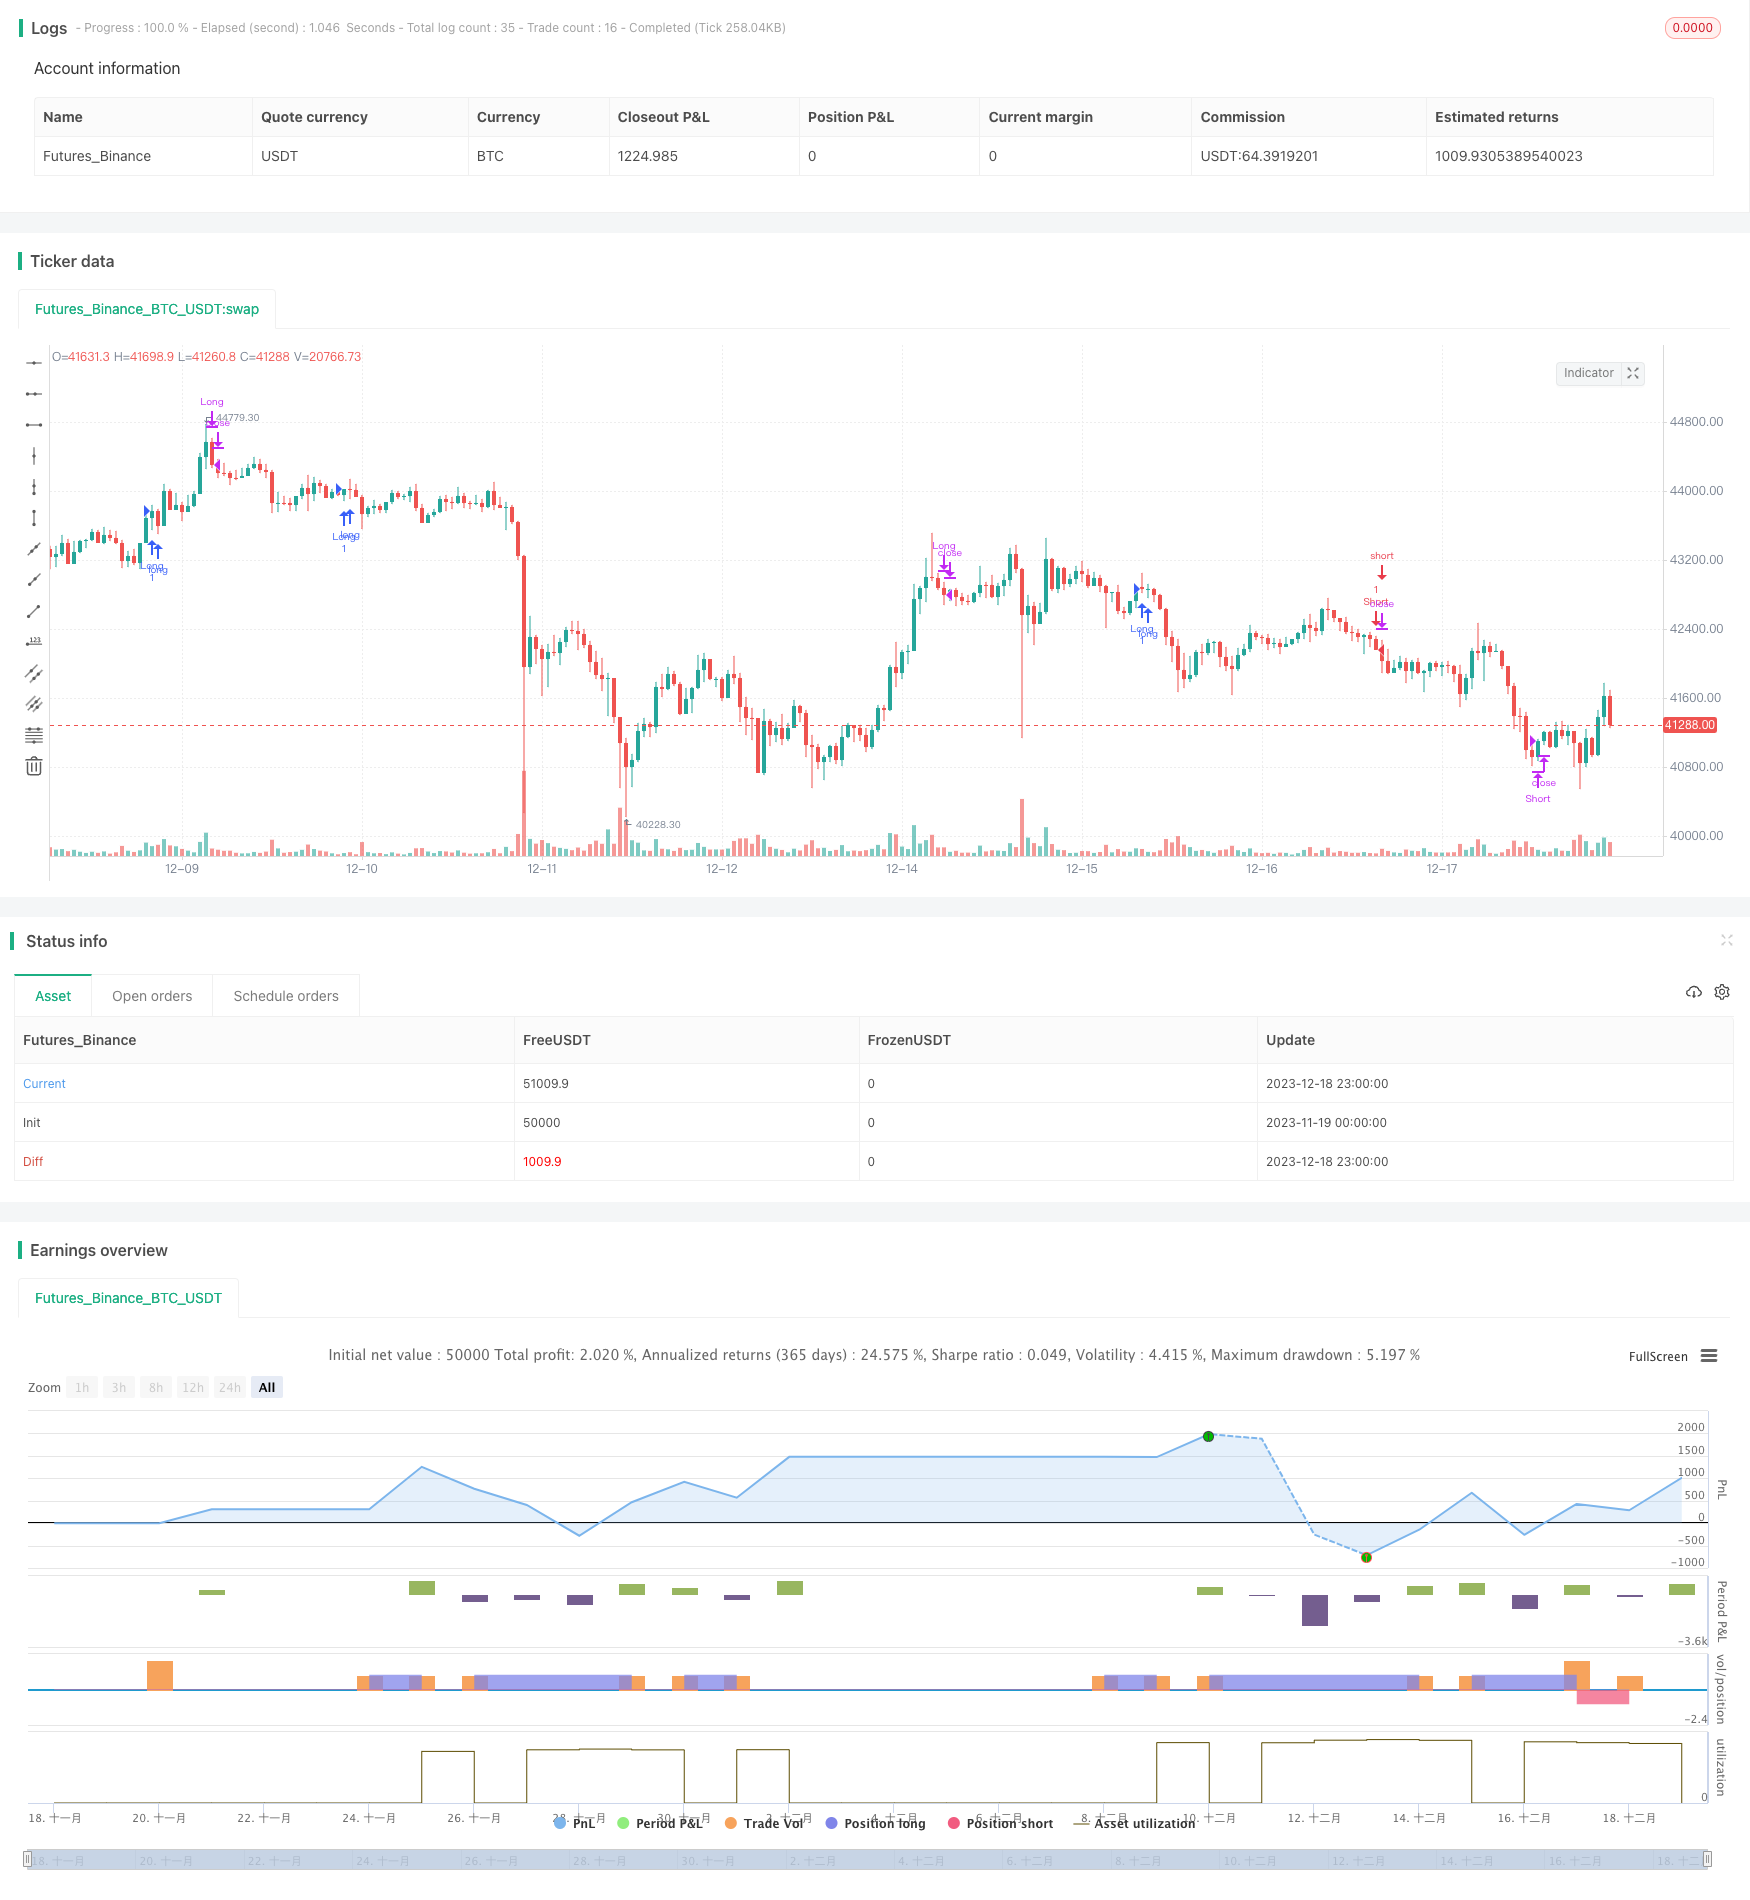
概述
该策略是一个基于RSI和EMA指标的趋势追踪和趋势突破交易策略。策略名为“RSI-EMA趋势突破策略”。它融合了趋势跟踪和震荡指标,旨在捕捉中长线趋势的方向,在趋势突破点进行入场。
策略原理
策略使用5日EMA,20日EMA和50日EMA构建多空趋势框架。当5日EMA上穿20日EMA,并且这两个EMA都处于50日EMA之上时,确定最近出现多头趋势突破,做多;当5日EMA下穿20日EMA,并且这两个EMA都处于50日EMA之下时,确定最近出现空头趋势突破,做空。
同时,策略还结合RSI指标判断是否过量超买或超卖区域。RSI可以有效识别超买超卖情况,避免在趋势置顶或盘整时产生错误信号。当RSI指标出现由超买区进入中性区时,多单止盈;当RSI指标出现由超卖区进入中性区时,空单止盈。
策略优势分析
该策略结合EMA和RSI指标,既可以捕捉中长线趋势,又可以避免趋势末端的风险,具有非常好的风险收益比特征。其主要优势有:
- 使用EMA实现对趋势的判断,EMA平滑价格,有助于识别趋势方向
- RSI指标可以避免买入超买区域,卖出超卖区域,规避风险
- 策略操作频率较低,适合中长线持有,降低交易成本和滑点成本
风险分析
该策略也存在一些风险,主要体现在:
- 在震荡行情中,EMA和RSI将产生更多错误信号,这会导致过多无效交易的出现。
- 突破失败是常见情况,需要设置止损来控制损失。
- 部分趋势行情中,RSI并不会进入超买超卖区域,这时用RSI判断入场和止盈会错过部分机会。
为了降低这些风险,我们可以设置交易止损,调整RSI参数,或者结合其他指标进行确认。
优化方向
该策略还有进一步优化的空间:
- 可以测试不同的参数,如EMA周期参数、RSI参数等的组合,选择最佳参数。
- 可以加入别的指标,如MACD、布林带等来确认交易信号,降低错误率。
- 可以通过机器学习等方法来动态优化参数设置。
- 可以建立趋势判断系统,在不同市场环境中动态调整策略参数。
总结
该RSI-EMA趋势突破策略综合考虑趋势跟踪和入场时机判断,在控制风险的基础上获取趋势收益,是一个非常实用的中长线策略。我们可以通过参数优化、加入其他指标等方法来进一步提高策略稳定性和收益率。
策略源码
/*backtest
start: 2023-11-19 00:00:00
end: 2023-12-19 00:00:00
period: 1h
basePeriod: 15m
exchanges: [{"eid":"Futures_Binance","currency":"BTC_USDT"}]
*/

// This source code is subject to the terms of the Mozilla Public License 2.0 at https://mozilla.org/MPL/2.0/
// © BrendanW98

//@version=4
strategy("My Strategy", overlay=true)

ema5 = ema(close, 9)
ema20 = ema(close, 21)
ema50 = ema(close, 55)

//RSI Signals
// Get user input
rsiSource = close
rsiLength = 14
rsiOverbought = 70
rsiOversold = 30
rsiMid = 50
// Get RSI value
rsiValue = rsi(rsiSource, rsiLength)

//See if RSI crosses 50
doBuy = crossover(rsiValue, rsiOversold) and rsiValue < 50
doSell = crossunder(rsiValue, rsiOverbought) and rsiValue > 50

emacrossover = crossover(ema5, ema20) and ema5 > ema50 and ema20 > ema50 and close > ema50
emacrossunder = crossunder(ema5, ema20) and ema5 < ema50 and ema20 < ema50 and close < ema50

//Entry and Exit
longCondition = emacrossover
closelongCondition = doSell

strategy.entry("Long", strategy.long, 1, when=longCondition)
strategy.close("Long", when=closelongCondition)


shortCondition = emacrossunder
closeshortCondition = doBuy

strategy.entry("Short", strategy.short, 1, when=shortCondition)
strategy.close("Short", when=closeshortCondition)