概述
该策略通过计算不同周期的均线,判断价格突破关键均线,实现低风险趋势追踪。
策略原理
当10日均线上穿200日均线,并且20日均线上穿50日均线时,做多;当10日均线下穿200日均线,并且20日均线下穿50日均线时,做空。这里通过双重均线判断,可以有效过滤假突破。
策略首先计算10日、20日、50日和200日四条不同周期的指数移动平均线(EMA)。其中,10日线代表短期趋势,20日线代表中期趋势,50日线代表中长期趋势,200日线代表长期趋势。当短期趋势线上穿或下穿长期趋势线时,表示价格可能出现较大的向上或向下突破。但如果仅仅依靠一条均线的突破来判断,容易出现假突破。所以策略采用了双重均线判断:即10日线和200日线构成第一道关口判断长短期趋势关系,20日线和50日线构成第二道关口判断中长期趋势关系。只有当两道关口的判断结果一致时,才会产生交易信号。
这样通过双重均线过滤,可以有效降低假突破概率,使得产生的交易信号更加可靠。
策略优势
- 使用双重均线判断,可有效过滤假突破,信号更加可靠
- 多时间周期参与,判断过程更为全面和谨慎
- 参数设置简单,容易理解和使用
策略风险
- 跟随趋势能力较强,但没有利用反转机会
- 当趋势发生转折时,止损可能较大
- 需要较长的历史数据支持,新股或数据不足时效果可能不佳
可以通过适当放宽均线突破的幅度来改善,或者加入其他指标如成交量的确认来优化。
策略优化方向
- 增加成交量的确认。交易量可以验证价格的突破,避免在低量的假突破下入场。
- 结合其它指标,如MACD、KDJ等作为辅助。更多指标可以提高系统稳定性。
- 自动优化参数。通过遗传算法等优化10日、20日等均线的参数设置,适应不同市场环境。
综上所述,该策略整体以双均线为主,辅以参数优化、成交量以及其它指标,可以有效构建一个稳定的趋势跟踪体系。
总结
该策略总体来说是一个简单实用的趋势跟踪策略。它使用双重均线作为主要交易判断依据,通过双重过滤降低假突破概率,产生的信号更加可靠。同时,参数设置简单,容易掌握使用。完善的风险管理和进一步的优化仍有很大的空间,可以使策略更加稳定和盈利。总之,该策略以其简单性见长,适合做为量化交易的入门策略来使用。
策略源码
/*backtest
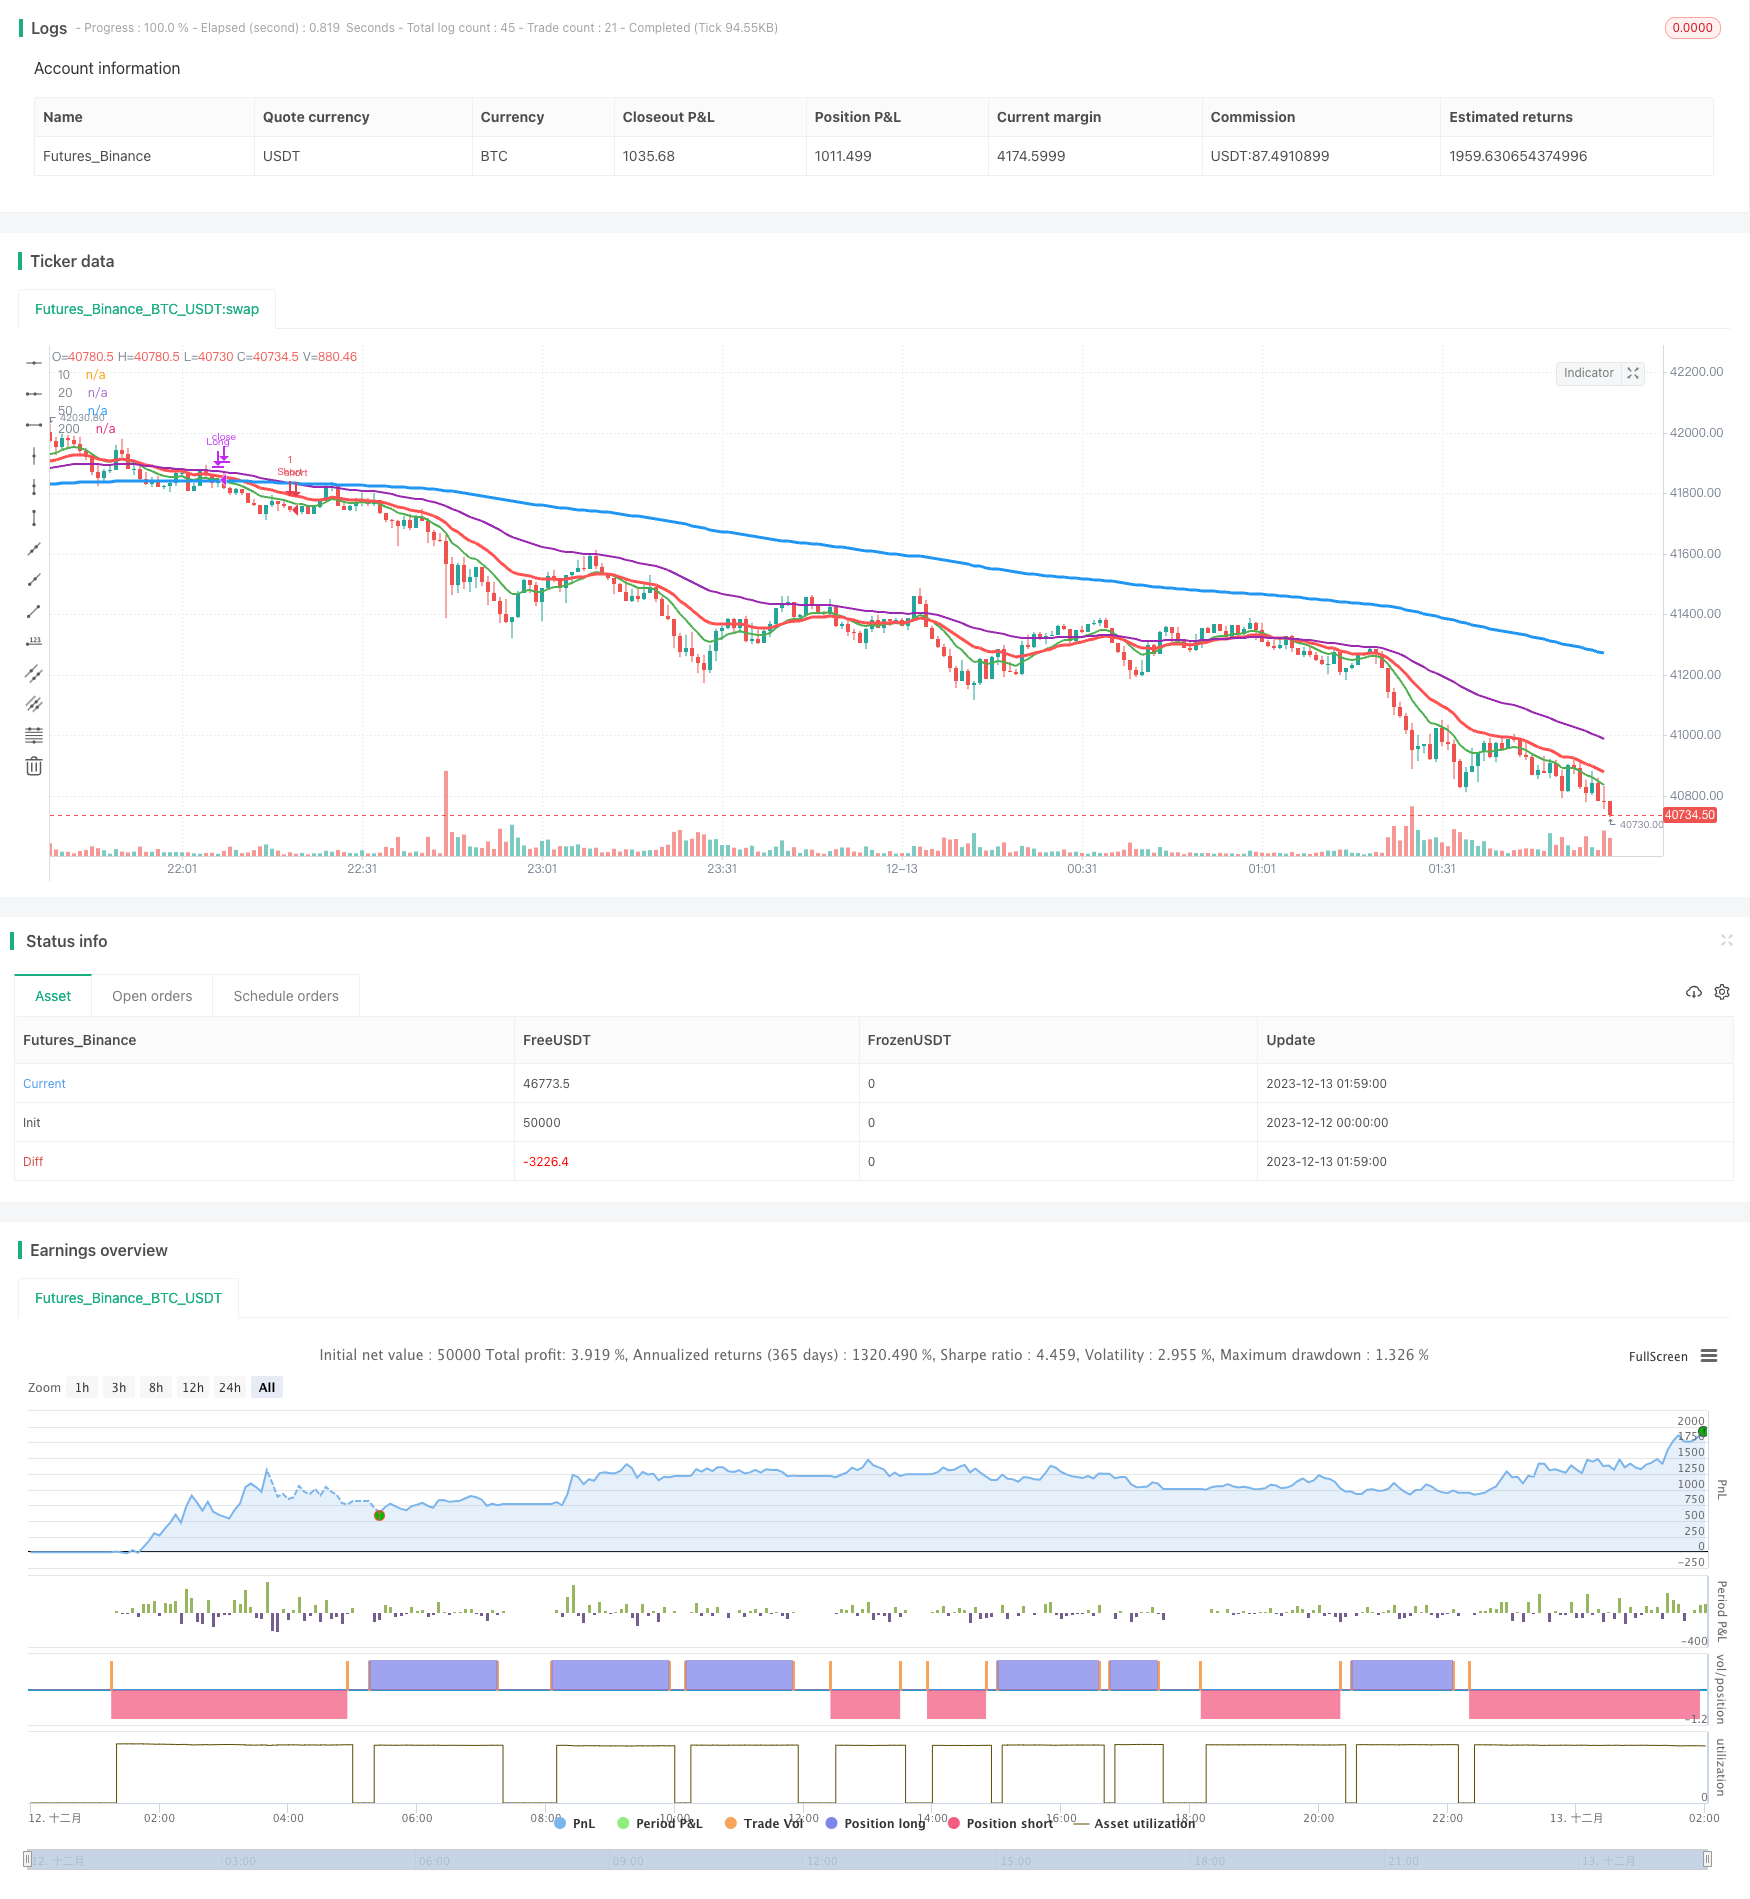
start: 2023-12-12 00:00:00
end: 2023-12-13 02:00:00
period: 1m
basePeriod: 1m
exchanges: [{"eid":"Futures_Binance","currency":"BTC_USDT"}]
*/
//@version=3
strategy("Advancing Our Basic Strategy", overlay=true)
ema10 = ema(close, 10)
ema20 = ema(close, 20)
ema50 = ema(close, 50)
ema200 = ema(close, 200)
long = ema10 > ema200 and ema20 > ema50
short = ema10 < ema200 and ema20 < ema50
longcondition = long and long[10] and not long[11]
shortcondition = short and short[10] and not short[11]
closelong = ema10 < ema200 or ema20 < ema50 and not long[11]
closeshort = ema10 > ema200 or ema20 > ema50 and not short[11]
plot(ema10, title="10", color=green, linewidth=2)
plot(ema20, title="20", color=red, linewidth=3)
plot(ema50, title="50", color=purple, linewidth=2)
plot(ema200, title="200", color=blue, linewidth=3)
testPeriodStart = timestamp(2018,8,1,0,0)
testPeriodStop = timestamp(2038,8,30,0,0)
if time >= testPeriodStart and time <= testPeriodStop
strategy.entry("Long", strategy.long, 1, when=longcondition)
strategy.entry("Short", strategy.short, 1, when=shortcondition)
strategy.close("Long", when = closelong)
strategy.close("Short", when = closeshort)