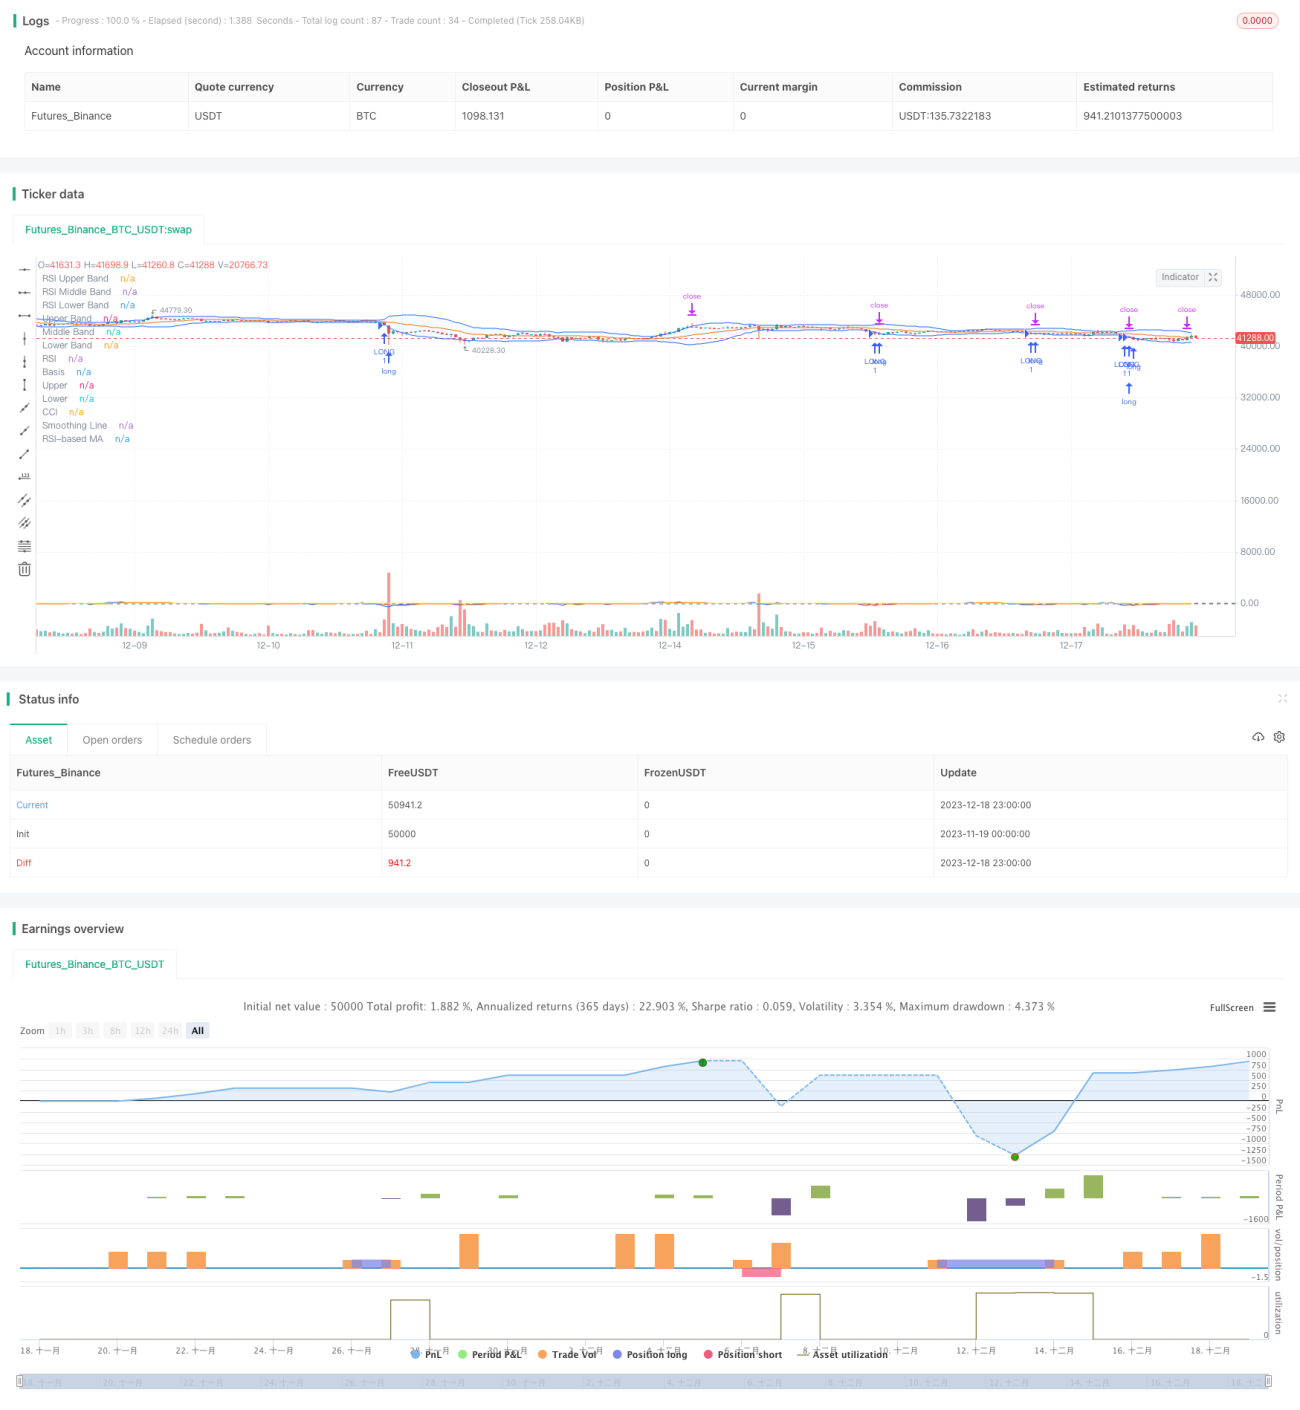
Quantitative Strategy: Bollinger Bands RSI CCI Crossover Strategy

Author: ChaoZhang, Date: 2023-12-20 16:24:49
Tags:

img

Overview

This strategy combines Bollinger Bands, Relative Strength Index (RSI) and Commodity Channel Index (CCI) to find crossover signals and generate buy and sell signals. The strategy aims to identify overbought and oversold scenarios in the market and take positions at inflection points for better investment returns.

Strategy Logic

Bollinger Bands

Bollinger Bands consist of a middle band, an upper band and a lower band. The middle band is usually a 20-day moving average. The upper band is two standard deviations above the middle band. The lower band is two standard deviations below. Prices near the lower band may indicate an oversold condition. Prices near the upper band may indicate an overbought condition.

RSI

The RSI measures the velocity of directional price movements up and down. It shows overbought above 70 and oversold below 30. When RSI falls from above 70, it can be a sell signal. When RSI bounces up from below 30, it can be a buy signal.

CCI

The CCI measures how far prices have moved from the average price. Readings above +100 imply an overbought condition. Readings below -100 imply an oversold condition. CCI reflects extreme price levels.

Crossover Signals

This strategy uses Bollinger Bands to judge short-term overbought/oversold levels, RSI to gauge bullish/bearish momentum and CCI to identify price extremes. When all three indicators flash buy/sell signals, the strategy will issue trade orders.

Advantages

  1. Combining multiple indicators improves signal accuracy and reduces false signals
  2. Captures reversal opportunities at turning points
  3. Customizable parameters adapt to different market conditions
  4. Smoothed CCI filter reduces noise and improves stability

Risks and Solutions

  1. All three indicators may produce bad signals resulting in losses. Parameters can be loosened or add other filters.
  2. CCI struggles with choppy markets. Can substitute with moving averages or volatility indicators.
  3. Only stop loss in place without profit taking. Can add trailing stops to lock in some profits.

Optimization Opportunities

  1. Test more parameter combinations to find optimum setup
  2. Introduce machine learning to auto adjust parameters
  3. Add profit taking strategies with profit targets
  4. Incorporate more indicators like MACD, KD to validate signals

Conclusion

This strategy analyzes overall market conditions using Bollinger Bands, RSI and CCI indicators. It identifies inflection points through crossover signals to trade market reversals. With further optimizations like parameter tuning, profit taking mechanisms etc., it can be a robust countertrend strategy for various market environments.


/*backtest
start: 2023-11-19 00:00:00
end: 2023-12-19 00:00:00
period: 1h
basePeriod: 15m
exchanges: [{"eid":"Futures_Binance","currency":"BTC_USDT"}]
*/

//@version=5
strategy(shorttitle="BBRSIstr", title="Bollinger Bands", overlay=true)
length = input.int(20, minval=1)
maType = input.string("SMA", "Basis MA Type", options = ["SMA", "EMA", "SMMA (RMA)", "WMA", "VWMA"])
src = input(close, title="Source")
mult = input.float(2.0, minval=0.001, maxval=50, title="StdDev")

ma(source, length, _type) =>
    switch _type
        "SMA" => ta.sma(source, length)
        "EMA" => ta.ema(source, length)
        "SMMA (RMA)" => ta.rma(source, length)
        "WMA" => ta.wma(source, length)
        "VWMA" => ta.vwma(source, length)

basis = ma(src, length, maType)
dev = mult * ta.stdev(src, length)
upper = basis + dev
lower = basis - dev
offset = input.int(0, "Offset", minval = -500, maxval = 500)
plot(basis, "Basis", color=#FF6D00, offset = offset)
p1 = plot(upper, "Upper", color=#2962FF, offset = offset)
p2 = plot(lower, "Lower", color=#2962FF, offset = offset)
fill(p1, p2, title = "Background", color=color.rgb(33, 150, 243, 95))

//RSI
rsiLengthInput = input.int(14, minval=1, title="RSI Length", group="RSI Settings")
rsiSourceInput = input.source(close, "Source", group="RSI Settings")
maTypeInput = input.string("SMA", title="MA Type", options=["SMA", "Bollinger Bands", "EMA", "SMMA (RMA)", "WMA", "VWMA"], group="MA Settings")
maLengthInput = input.int(14, title="MA Length", group="MA Settings")
bbMultInput = input.float(2.0, minval=0.001, maxval=50, title="BB StdDev", group="MA Settings")
showDivergence = input.bool(false, title="Show Divergence", group="RSI Settings")

up = ta.rma(math.max(ta.change(rsiSourceInput), 0), rsiLengthInput)
down = ta.rma(-math.min(ta.change(rsiSourceInput), 0), rsiLengthInput)
rsi = down == 0 ? 100 : up == 0 ? 0 : 100 - (100 / (1 + up / down))
rsiMA = ma(rsi, maLengthInput, maTypeInput)
isBB = maTypeInput == "Bollinger Bands"

rsiPlot = plot(rsi, "RSI", color=#7E57C2)
plot(rsiMA, "RSI-based MA", color=color.yellow)
rsiUpperBand = hline(70, "RSI Upper Band", color=#787B86)
midline = hline(50, "RSI Middle Band", color=color.new(#787B86, 50))
rsiLowerBand = hline(30, "RSI Lower Band", color=#787B86)
fill(rsiUpperBand, rsiLowerBand, color=color.rgb(126, 87, 194, 90), title="RSI Background Fill")

//cci
ma = ta.sma(src, length)
cci = (src - ma) / (0.015 * ta.dev(src, length))
plot(cci, "CCI", color=#2962FF)
band1 = hline(100, "Upper Band", color=#787B86, linestyle=hline.style_dashed)
hline(0, "Middle Band", color=color.new(#787B86, 50))
band0 = hline(-100, "Lower Band", color=#787B86, linestyle=hline.style_dashed)
fill(band1, band0, color=color.rgb(33, 150, 243, 90), title="Background")

typeMA = input.string(title = "Method", defval = "SMA", options=["SMA", "EMA", "SMMA (RMA)", "WMA", "VWMA"], group="Smoothing")
smoothingLength = input.int(title = "Length", defval = 5, minval = 1, maxval = 100, group="Smoothing")

smoothingLine = ma(cci, smoothingLength, typeMA)
plot(smoothingLine, title="Smoothing Line", color=#f37f20, display=display.none)


longCBB= close < lower
shortCBB = close>upper
longBRSI = rsi < 33
shortBRSI = rsi > 70
longcci = cci < -215
shortcci = cci > 250

strategy.entry("LONG", strategy.long, when = longCBB and longBRSI and longcci)
strategy.exit("Exit ", profit = 600)
strategy.entry("SHORT", strategy.short, when = shortCBB and shortBRSI and shortcci)
strategy.exit("Exit ", profit = 600)

More