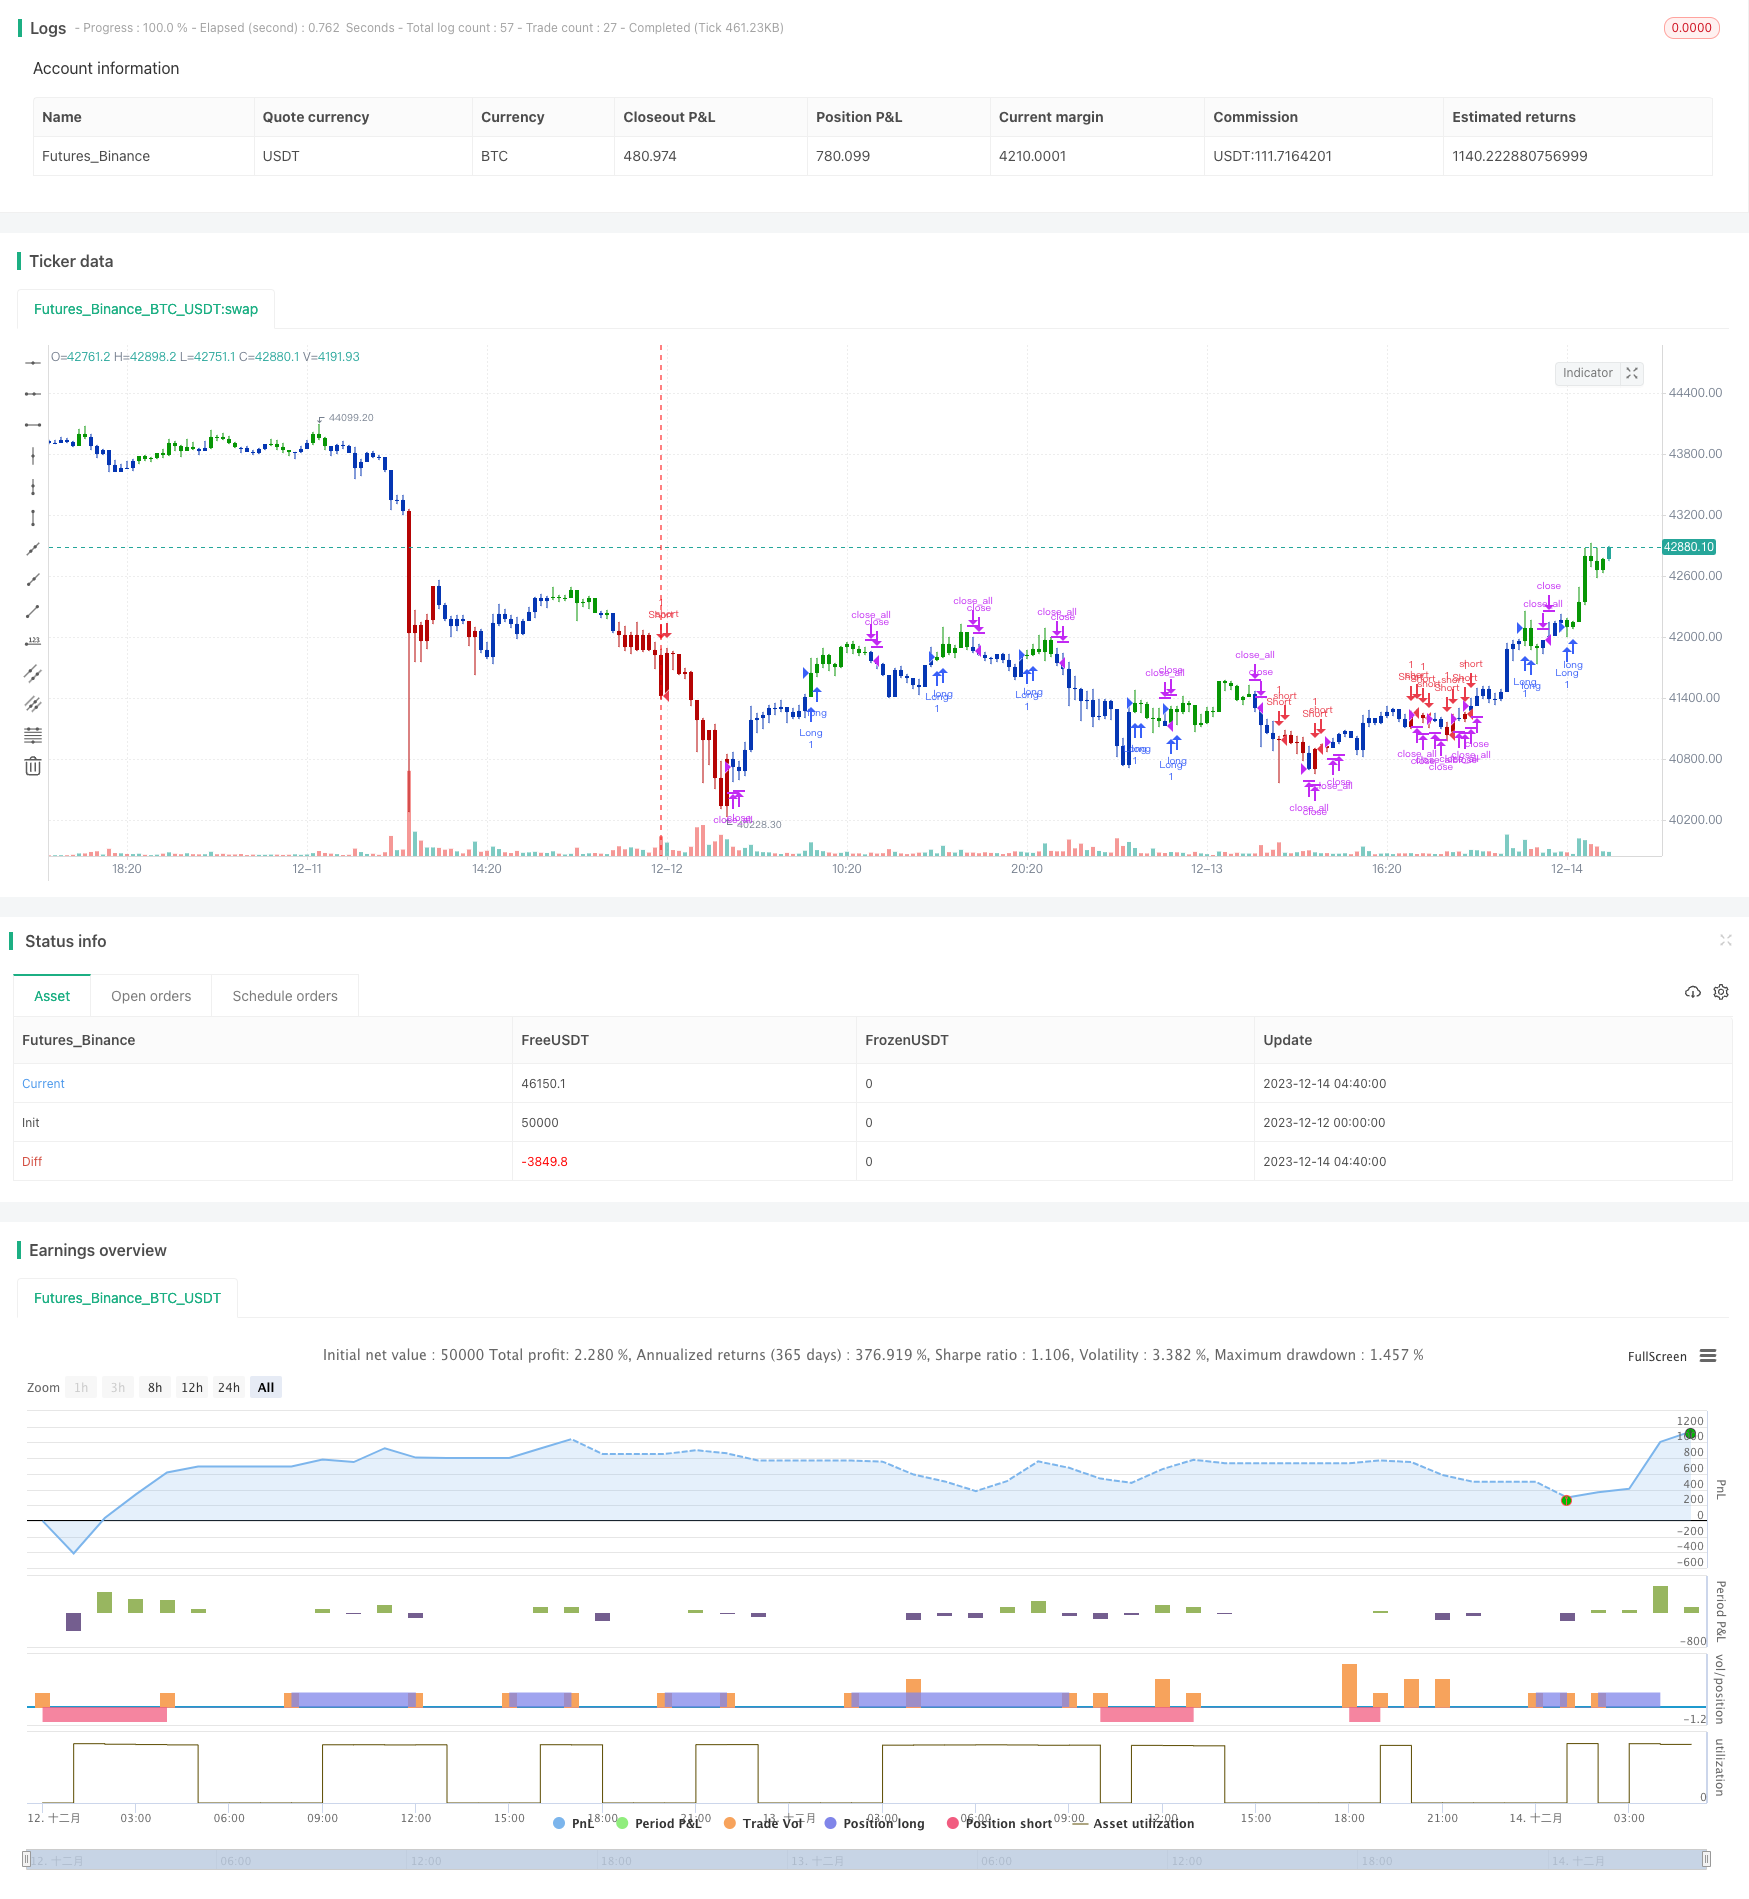
概述
本策略结合了123形态反转和超级振荡指标两个因子,实现了双因子量化反转追踪交易。其基本思路是在判断行情反转的同时,结合超级振荡指标的多空信号,实现更准确的 Entry timing。
该策略主要适用于中短线反转交易,通过多因子确认,可以有效过滤假反转,提高信号质量。
策略原理
- 123形态反转
判断前两天的收盘价和当前收盘价的大小关系,形成 “高-高-低”或”低-低-高”的形态,表明可能出现反转信号。
同时,要求Stochastic 指标处于超买超卖区域,进一步确认反转信号,过滤假反转。
超级振荡指标 (Awesome Oscillator)
Awesome Oscillator 是根据中短期均线和短期均线的差值构建的动量型指标。当快线从上向下穿越慢线时,为卖点;从下向上穿越时,为买点。
本策略采用该指标的多空态势判断买卖点。
双因子确认
通过123形态反转和 Awesome Oscillator 的双重确认,可以有效过滤假反转,提高Entry timing的准确性。
策略优势
采用双因子确定反转点位,可以有效过滤假反转信号。
Awesome Oscillator 作为动量指标,可以提高 Entry timing 的准确性。
Stochastic 指标的加入,可以避免追顶杀入和接底杀入的风险。
反转策略本身具有较高的胜率和盈亏比优势。
策略风险
反转失败风险仍然存在。采用双因子可以降低概率,但无法完全规避该风险。
过优化风险。指标参数设置需要针对不同市场进行测试优化,以防止过优化。
逆市风险。强势行情下,反转策略容易产生逆势亏损。可以设置止损来控制风险。
策略优化方向
测试优化指标参数组合,提高参数鲁棒性。
增加止损策略,控制单笔亏损。
结合行业、板块选择,避免选股不当。
优化持仓周期,防止过于盲目追踪。
测试不同的均线系统作为辅助条件。
总结
综上所述,该双因子量化反转追踪策略,在保证一定的盈利概率和盈亏比的基础上,采用 Awesome Oscillator 作为Entry timing辅助工具,并通过 Stochastic 指标避免追顶杀入,可以有效把控反转交易的风险,具有较强的实用性。
但反转策略本身的风险也不能忽视,仍需优化指标参数,设定止损条件等来控制风险。如果运用得当,该策略可以为投资者带来稳定的超额收益。
/*backtest
start: 2023-12-12 00:00:00
end: 2023-12-14 05:00:00
period: 20m
basePeriod: 1m
exchanges: [{"eid":"Futures_Binance","currency":"BTC_USDT"}]
*/

//@version=4
////////////////////////////////////////////////////////////
//  Copyright by HPotter v1.0 12/08/2021
// This is combo strategies for get a cumulative signal.
//
// First strategy
// This System was created from the Book "How I Tripled My Money In The
// Futures Market" by Ulf Jensen, Page 183. This is reverse type of strategies.
// The strategy buys at market, if close price is higher than the previous close
// during 2 days and the meaning of 9-days Stochastic Slow Oscillator is lower than 50.
// The strategy sells at market, if close price is lower than the previous close price
// during 2 days and the meaning of 9-days Stochastic Fast Oscillator is higher than 50.
//
// Second strategy
//    This indicator is based on Bill Williams` recommendations from his book
//    "New Trading Dimensions". We recommend this book to you as most useful reading.
//    The wisdom, technical expertise, and skillful teaching style of Williams make
//    it a truly revolutionary-level source. A must-have new book for stock and
//    commodity traders.
//    The 1st 2 chapters are somewhat of ramble where the author describes the
//    "metaphysics" of trading. Still some good ideas are offered. The book references
//    chaos theory, and leaves it up to the reader to believe whether "supercomputers"
//    were used in formulating the various trading methods (the author wants to come across
//    as an applied mathemetician, but he sure looks like a stock trader). There isn't any
//    obvious connection with Chaos Theory - despite of the weak link between the title and
//    content, the trading methodologies do work. Most readers think the author's systems to
//    be a perfect filter and trigger for a short term trading system. He states a goal of
//    10%/month, but when these filters & axioms are correctly combined with a good momentum
//    system, much more is a probable result.
//    There's better written & more informative books out there for less money, but this author
//    does have the "Holy Grail" of stock trading. A set of filters, axioms, and methods which are
//    the "missing link" for any trading system which is based upon conventional indicators.
//    This indicator plots the oscillator as a histogram where periods fit for buying are marked
//    as blue, and periods fit for selling as red. If the current value of AC (Awesome Oscillator)
//    is over the previous, the period is deemed fit for buying and the indicator is marked blue.
//    If the AC values is not over the previous, the period is deemed fir for selling and the indicator
//    is marked red.
//
// WARNING:
// - For purpose educate only
// - This script to change bars colors.
////////////////////////////////////////////////////////////
Reversal123(Length, KSmoothing, DLength, Level) =>
    vFast = sma(stoch(close, high, low, Length), KSmoothing)
    vSlow = sma(vFast, DLength)
    pos = 0.0
    pos := iff(close[2] < close[1] and close > close[1] and vFast < vSlow and vFast > Level, 1,
	         iff(close[2] > close[1] and close < close[1] and vFast > vSlow and vFast < Level, -1, nz(pos[1], 0)))
	pos


BWAO(nLengthSlow,nLengthFast) =>
    pos = 0.0
    xSMA1_hl2 = sma(hl2, nLengthFast)
    xSMA2_hl2 = sma(hl2, nLengthSlow)
    xSMA1_SMA2 = xSMA1_hl2 - xSMA2_hl2
    pos := iff(xSMA1_SMA2 > xSMA1_SMA2[1], 1,
    	      iff(xSMA1_SMA2 < xSMA1_SMA2[1], -1, nz(pos[1], 0)))
    pos

strategy(title="Combo Backtest 123 Reversal & Awesome Oscillator (AO)", shorttitle="Combo", overlay = true)
line1 = input(true, "---- 123 Reversal ----")
Length = input(14, minval=1)
KSmoothing = input(1, minval=1)
DLength = input(3, minval=1)
Level = input(50, minval=1)
//-------------------------
line2 = input(true, "---- Awesome Oscillator (AO) ----")
nLengthSlow = input(34, minval=1, title="Length Slow")
nLengthFast = input(5, minval=1, title="Length Fast")
reverse = input(false, title="Trade reverse")
posReversal123 = Reversal123(Length, KSmoothing, DLength, Level)
posBWAO = BWAO(nLengthSlow,nLengthFast)
pos = iff(posReversal123 == 1 and posBWAO == 1 , 1,
	   iff(posReversal123 == -1 and posBWAO == -1, -1, 0))
possig = iff(reverse and pos == 1, -1,
          iff(reverse and pos == -1 , 1, pos))
if (possig == 1 )
    strategy.entry("Long", strategy.long)
if (possig == -1 )
    strategy.entry("Short", strategy.short)
if (possig == 0)
    strategy.close_all()
barcolor(possig == -1 ? #b50404: possig == 1 ? #079605 : #0536b3 )