概述
该策略基于市场技术分析中非常有名的一种指标——Ichimoku Kinko Hyo指标,利用其中的云图形态以及价格与云的关系来判断趋势方向,以发现交易机会。当价格突破云层时产生交易信号。该策略适用于中长线位置式交易。
策略原理
该策略使用Ichimoku Kinko Hyo指标的几个组成部分,包括转换线(Tenkan-Sen)、基准线(Kijun-Sen)、前沿线(Senkou Span A)、先导线(Senkou Span B)以及滞后线(Chikou Span)。这几条线汇聚形成所谓的Ichimoku云。当价格突破云层时,产生买入和卖出信号。
具体来说,策略判断价格是否突破云层主要依据Senkou Span A 和Senkou Span B两条线。这两条线之间的区域构成云层。当价格收盘突破云层上沿时产生买入信号;当价格收盘突破云层下沿时产生卖出信号。
此外,策略还设定了止损和止盈价格。利用syminfo.pointvalue和策略头寸信息计算盈亏点数,再转换为具体价格。
优势分析
该策略具有以下几个优势:
- 使用Ichimoku指标判断趋势方向,可以有效过滤市场噪音,识别中长线趋势
- 突破云层形成信号,可以避免假突破带来的损失
- 结合止损和止盈设置,可以限制单笔损失,锁定盈利
- 参数可调整,可以测试不同参数对策略表现的影响
- 可视化的云层和其他Ichimoku组成部分,形成直观的图形交易信号
风险分析
该策略也存在一定的风险:
- 中长线持仓,可能出现较大的浮亏
- 突破信号可能滞后,错过最佳入场点位
- 假突破可能造成错误信号和损失
- 持仓时间过长,衍生费用较高
- 设定的止损和止盈价格可能会被突破
对策:
- 适当缩短持仓周期,降低单笔浮亏风险
- 结合其他指标判断突破信号效力
- 提高止损止盈的有效性,避免被套
- 优化持仓期限,降低费用
优化方向
该策略可以从以下几个方面进行优化:
- 测试不同的参数组合,寻找最优参数
- 结合其他指标进行信号过滤,避免假突破
- 动态调整止损止盈水平, trails stop loss
- 自定义退出条件:突破云层反向信号、价格回撤幅度触发
- 添加仓位管理机制
总结
该Ichimoku阴阳烛线突破策略整体来说是一种典型的使用Ichimoku Kinko Hyo指标判断中长线趋势方向的突破策略。它具有参数可调、直观形态、可视化信号等优点,也存在一定的假突破风险、持仓风险等问题。通过参数优化、信号过滤、止损止盈设定等手段可以降低风险提高策略稳定性。该策略适用于中长期位置式交易,特别是突破云层形成信号时高效率进入趋势方向。总体来说,这是一个具有实战价值的量化策略。
策略源码
/*backtest
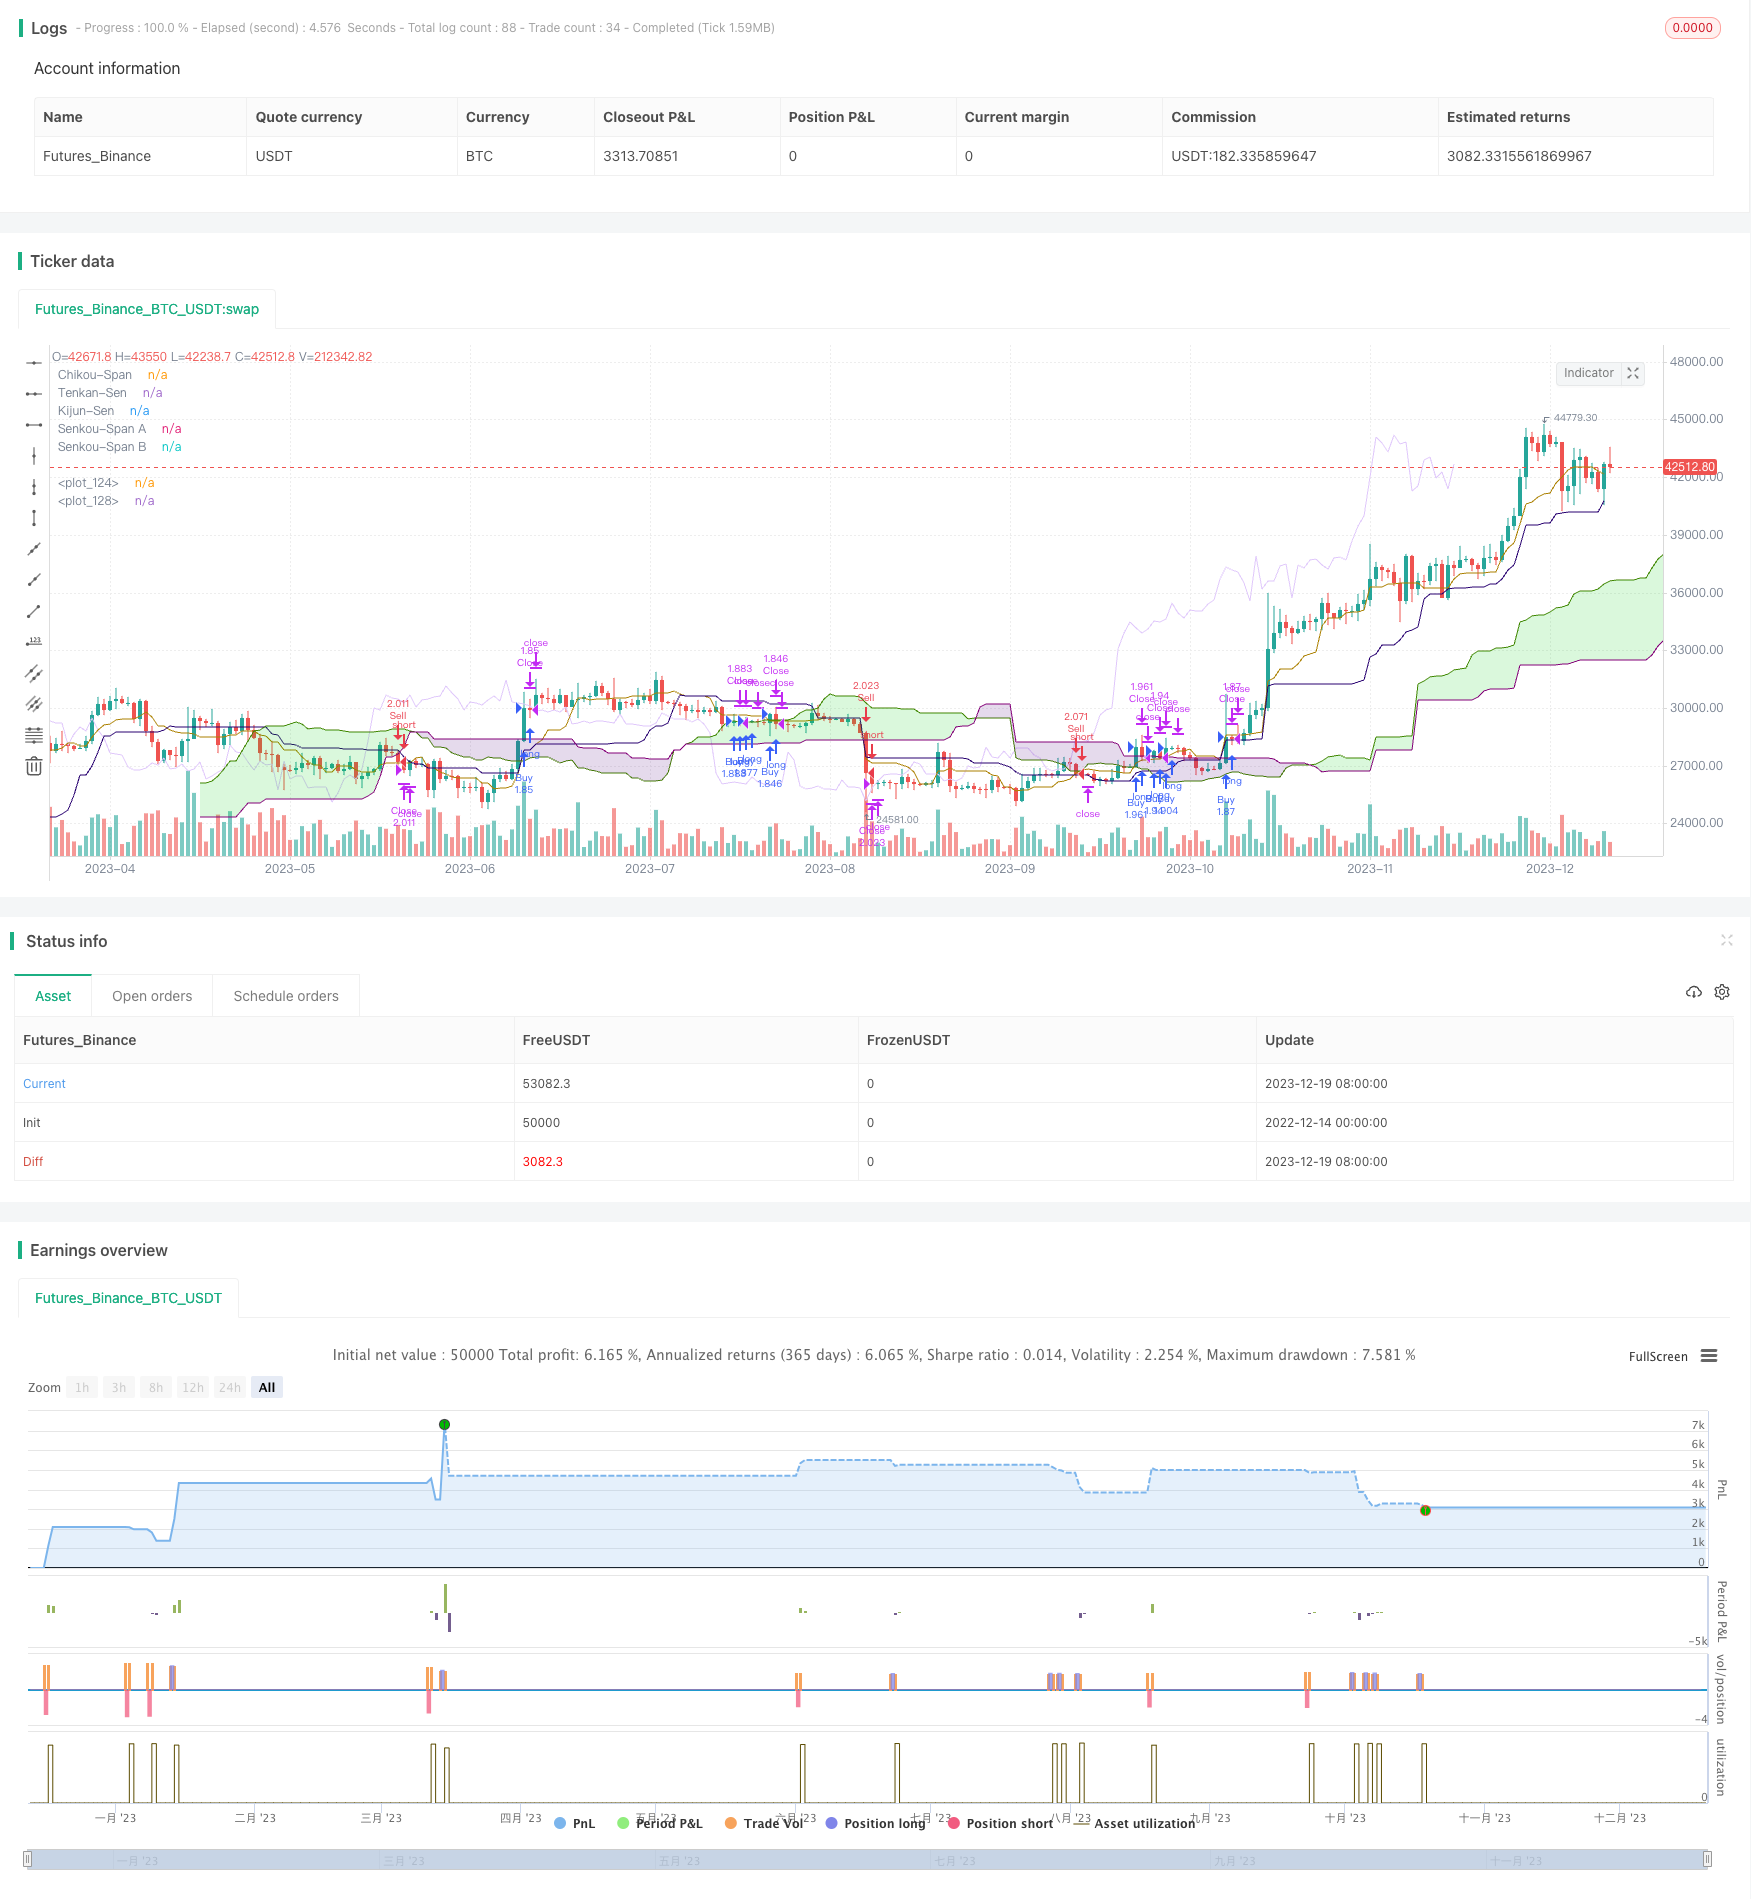
start: 2022-12-14 00:00:00
end: 2023-12-20 00:00:00
period: 1d
basePeriod: 1h
exchanges: [{"eid":"Futures_Binance","currency":"BTC_USDT"}]
*/
//@version=5
// This source code is subject to the terms of the Mozilla Public License 2.0 at https://mozilla.org/MPL/2.0/
// © moneyofthegame
// Basado en estrategias con el indicador ICHIMOKU KINKO HIYO
// El tiempo es oro colega :)
//@version=5
strategy('Ichimoku Cloud Estrategia Ruptura Nubes SWING TRADER (By Insert Cheese)', shorttitle='Ichimoku Cloud Estrategia Ruptura Nubes SWING TRADER (By Insert Cheese)',
overlay=true,
initial_capital=500,
process_orders_on_close=true,
default_qty_type=strategy.percent_of_equity,
default_qty_value=100,
commission_type=strategy.commission.percent,
commission_value=0.05,
currency=currency.NONE)
// Inputs: Ichimoku parametros
ts_bars = input.int(9, minval=1, title='Tenkan-Sen ', group='Parámetros Ichimoku')
ks_bars = input.int(26, minval=1, title='Kijun-Sen ', group='Parámetros Ichimoku')
ssb_bars = input.int(52, minval=1, title='Senkou-Span B ', group='Parámetros Ichimoku')
cs_offset = input.int(26, minval=1, title='Chikou-Span', group='Parámetros Ichimoku')
ss_offset = input.int(26, minval=1, title='Senkou-Span A', group='Parámetros Ichimoku')
middle(len) => // LONGITITUD Ichimoku (SenkouB)
math.avg(ta.lowest(len), ta.highest(len))
// Ichimoku Componentes
tenkan = middle (ts_bars)
kijun = middle (ks_bars)
senkouA = math.avg(tenkan, kijun)
senkouB = middle (ssb_bars)
// Plot Ichimoku Kinko Hyo
plot(tenkan, color=color.rgb(171, 128, 0), title="Tenkan-Sen", display = display.none)
plot(kijun, color=color.rgb(39, 0, 112), title="Kijun-Sen", display = display.none)
plot(close, offset=-cs_offset+1, color=color.rgb(224, 200, 251), title="Chikou-Span", display = display.none)
sa=plot(senkouA, offset=ss_offset-1, color=color.rgb(68, 128, 0), title="Senkou-Span A", display = display.none)
sb=plot(senkouB, offset=ss_offset-1, color=color.rgb(131, 0, 120), title="Senkou-Span B", display = display.none)
fill(sa, sb, color = senkouA > senkouB ? color.rgb(0, 211, 11, 82) : color.rgb(75, 0, 126, 82), title="Cloud color")
// Calculating
ss_high = math.max(senkouA[ss_offset - 1], senkouB[ss_offset - 1]) //parte alta de la nube
ss_low = math.min(senkouA[ss_offset - 1], senkouB[ss_offset - 1]) //parte baja de la nube
ss_medium = ss_low + (ss_high - ss_low) / 2 //parte intermedia
// Input para seleccionar largos o cortos
long_entry_enable = input.bool(true, title='Entradas Largo', group='Backtest Operativa', inline='SP20')
short_entry_enable = input.bool(true, title='Entradas Corto', group='Backtest Operativa', inline='SP20')
// Input backtest rango de fechas
fromMonth = input.int (defval=1, title='Desde Mes', minval=1, maxval=12, group='Backtest rango de fechas')
fromYear = input.int (defval=2000, title='Desde Año', minval=1970, group='Backtest rango de fechas')
fromDay = input.int (defval=1, title='Desde Día', minval=1, maxval=31, group='Backtest rango de fechas')
thruDay = input.int (defval=1, title='Hasta Día', minval=1, maxval=31, group='Backtest rango de fechas')
thruMonth = input.int (defval=1, title='Hasta Mes', minval=1, maxval=12, group='Backtest rango de fechas')
thruYear = input.int (defval=2099, title='Hasta Año', minval=1970, group='Backtest rango de fechas')
inDataRange = time >= timestamp(syminfo.timezone, fromYear, fromMonth, fromDay, 0, 0) and time < timestamp(syminfo.timezone, thruYear, thruMonth, thruDay, 0, 0)
//Estrategia
// Señales de entrada y salida
price_above_kumo = close > ss_high // precio cierra arriba de la nube
price_below_kumo = close < ss_low // precio cierra abajo de la nube
price_cross_above_kumo = ta.crossover (close , ss_high ) //precio cruza la nube parte alta
price_cross_below_kumo = ta.crossunder (close , ss_low ) // precio cruza la nube parte baja
bullish = (price_above_kumo and price_cross_above_kumo)
bearish = (price_below_kumo and price_cross_below_kumo)
comprado = strategy.position_size > 0
vendido = strategy.position_size < 0
sl_long = price_above_kumo
sl_short = price_below_kumo
if ( not comprado and bullish and inDataRange and long_entry_enable)
//realizar compra
strategy.entry("Buy", strategy.long)
//realizar salida long
if (comprado and bearish and inDataRange and long_entry_enable)
strategy.close ("Buy", comment = "cerrado")
if ( not vendido and bearish and inDataRange and short_entry_enable)
//realizar venta
strategy.entry("Sell", strategy.short)
//realizar salida long
if (vendido and bullish and inDataRange and short_entry_enable)
strategy.close ("Buy", comment = "cerrado")
// Función Calcular TP y SL
// Inputs para SL y TP
tpenable = input.bool(true, title = "SL y TP metodo")
moneyToSLPoints(money) =>
strategy.position_size !=0 and tpenable ? (money / syminfo.pointvalue / math.abs (strategy.position_size)) / syminfo.mintick : na
p = moneyToSLPoints(input.float( 100.0, minval=0.1, step=10.0, title = "Take Profit $$"))
l = moneyToSLPoints(input.float( 100.0, minval=0.1, step=10.0, title = "Stop Loss $$"))
strategy.exit("Close", profit = p, loss = l)
// debug plots for visualize SL & TP levels
pointsToPrice(pp) =>
na(pp) ? na : strategy.position_avg_price + pp * math.sign(strategy.position_size) * syminfo.mintick
pp = plot(pointsToPrice(p),color = color.rgb(76, 175, 79, 96), style = plot.style_linebr )
lp = plot(pointsToPrice(-l),color = color.rgb(76, 175, 79, 96), style = plot.style_linebr )
avg = plot( strategy.position_avg_price, color = color.rgb(76, 175, 79, 96), style = plot.style_linebr )
fill(pp, avg, color = color.rgb(76, 175, 79, 96))
fill(avg, lp, color = color.rgb(255, 82, 82, 97))