概述
动态加权移动平均线多空策略是一种适用于加密货币等高波动性市场的交易策略。该策略运用快速和慢速移动平均线实现多空判断,加入动态加权机制提高敏感度,还使用EMA滤波和颜色渲染识别趋势状态。核心思路是捕捉短期价格变化从而获取超额收益。
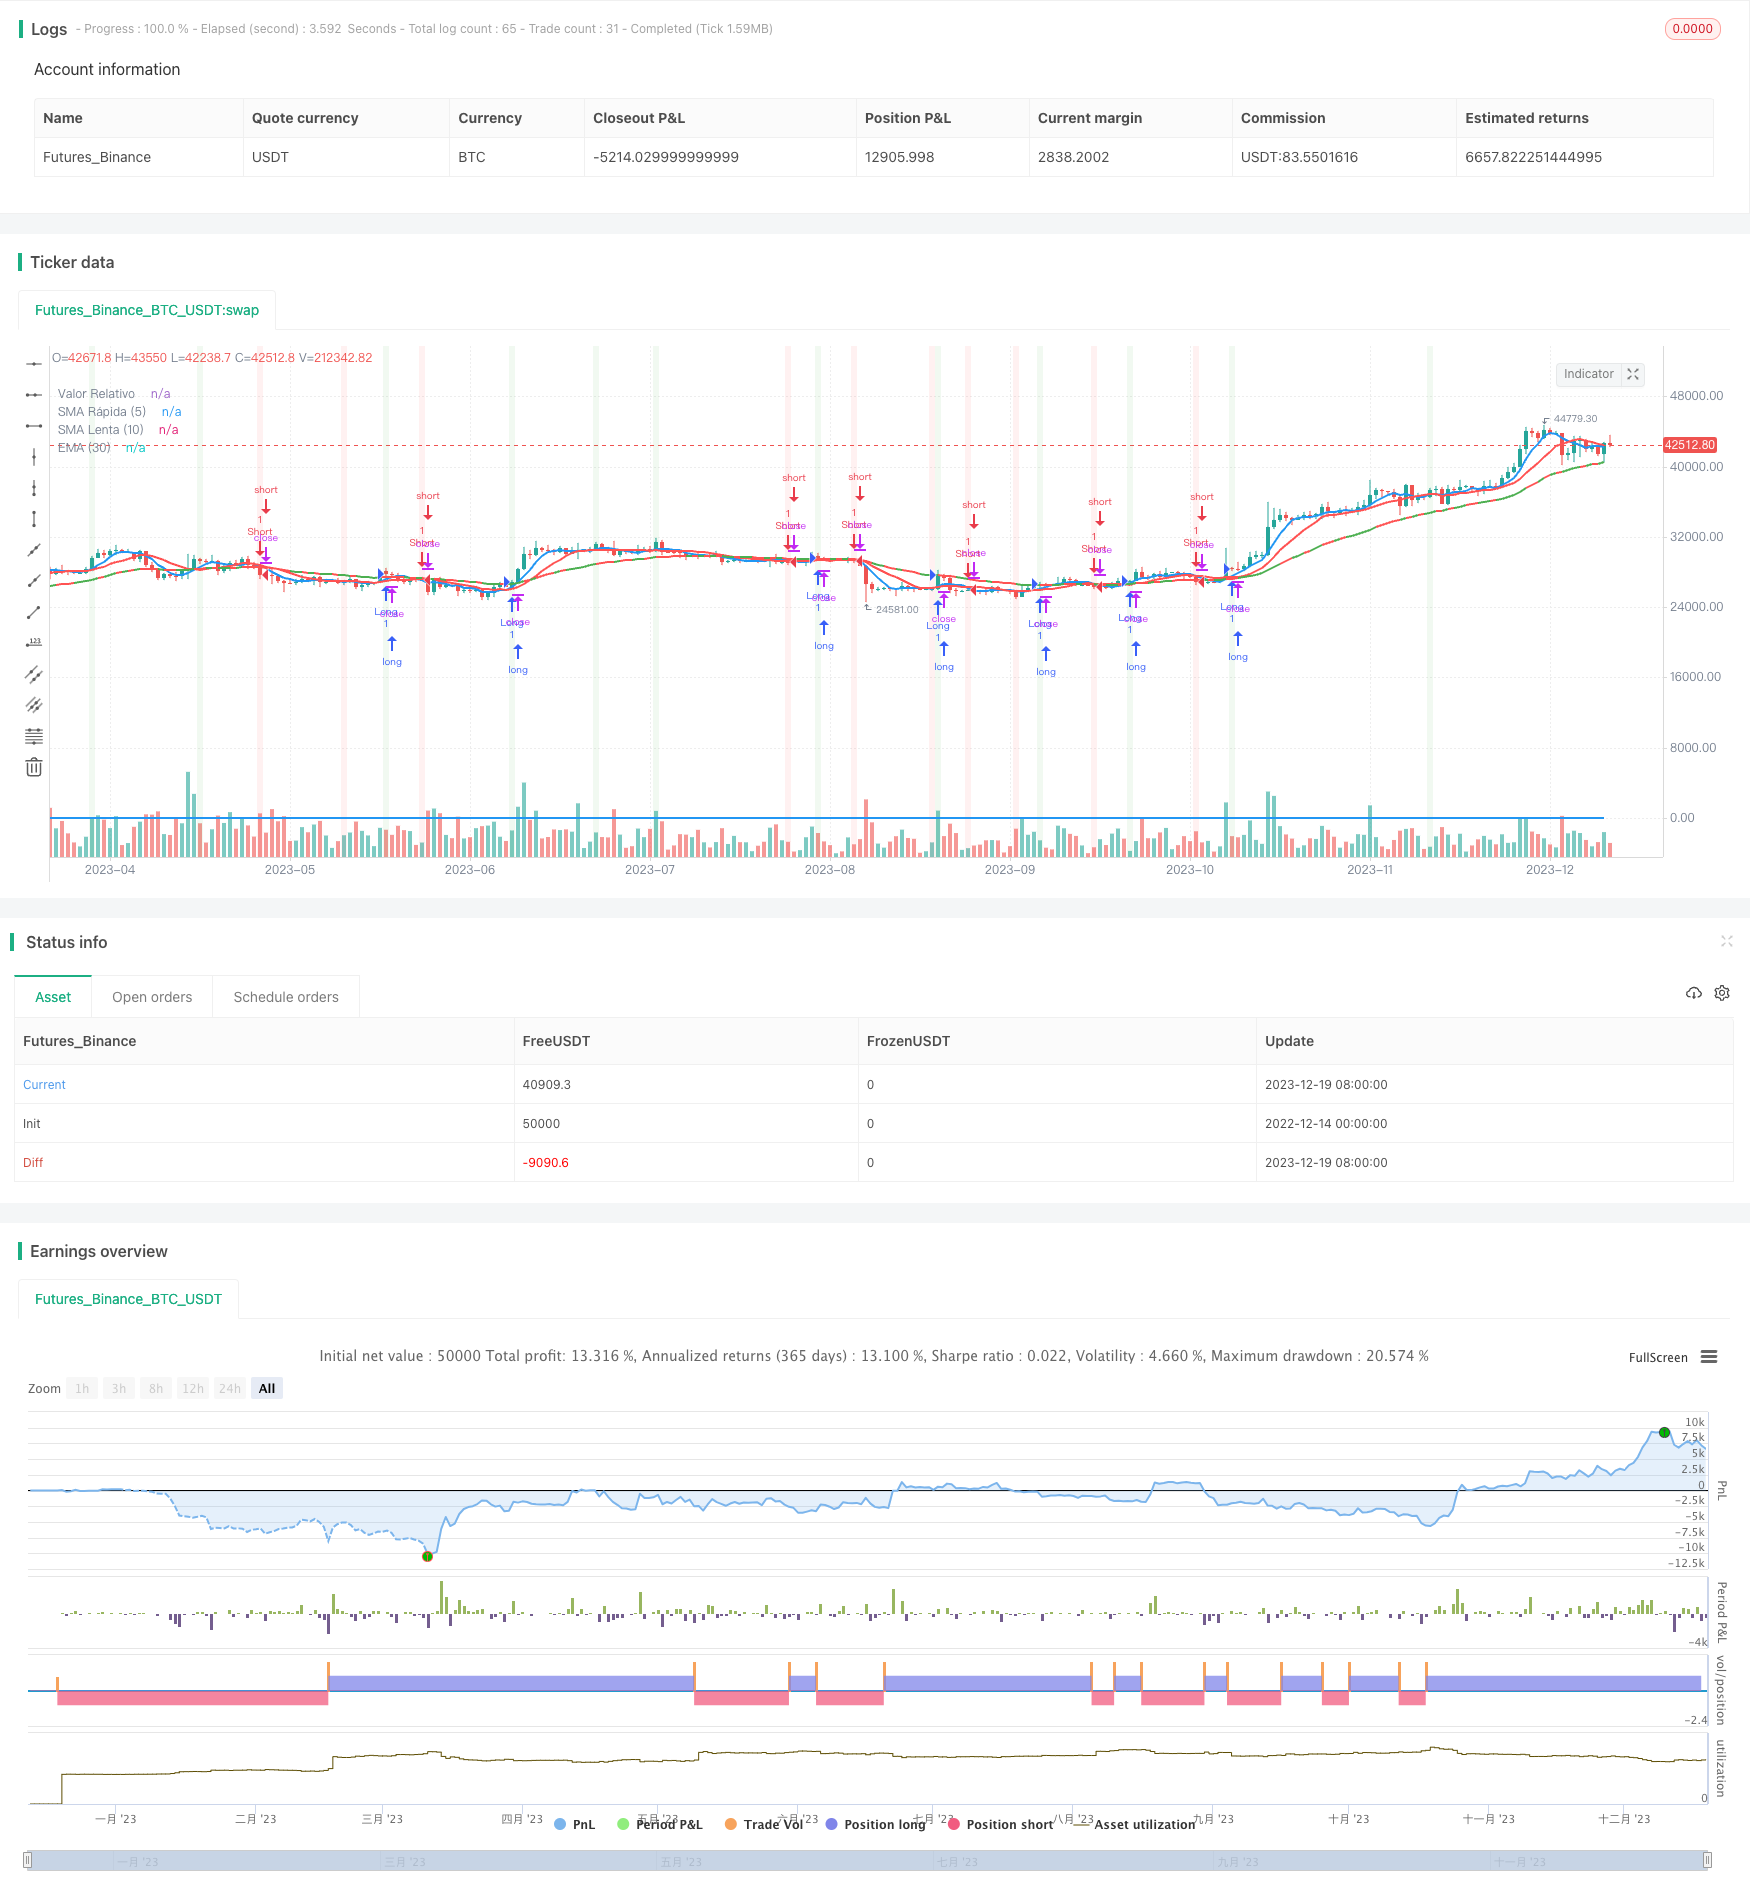
策略原理
该策略由布尔变量、指标和入场逻辑三部分组成。指标部分包含30日EMA、5日快速SMA、10日慢速SMA。策略入场判断为快速SMA上穿慢速SMA做多,下穿做空。同时考虑与30日EMA关系作为过滤条件,价格高于EMA时可做多,价格低于EMA时可做空。这利用了快速SMA对短期价格变化高敏感性的特点,慢速SMA发挥过滤假突破的作用,EMA扮演趋势判断指标,共同形成交易信号。
颜色渲染部分通过设置背景色标识多空状态。当快慢SMA发生金叉时,识别为上升趋势并填色;死叉则识别为下跌趋势填色。此举直观反映市场热度,形成清晰易读的视觉效果。
优势分析
该策略最大优势是短期捕捉能力强。快速SMA参数选择仅为5日线,可高效捕捉价格变化。加入EMA滤波有效过滤震荡回调。此外还引入动态SMA权重设计,使最近价格对均线贡献更大,保证策略的实时性。
相比起单一EMA或SMA策略,该策略融合多种技术指标形成交易组合。快慢SMA互补识别信号,EMA提供趋势判断,使策略更具弹性。颜色渲染也使策略形成直观易读界面,操作更加明确。
风险及对策
该策略主要风险在于快速SMA参数设置过于灵敏,可能产生大量假信号。此时需适当调高SMA周期数值降低误报率。
另外在震荡行情中,EMA的趋势判断效果较弱。这时可考虑加入比如BOLL通道等指标辅助判定。
当遭遇重大黑天鹅事件,策略也会面临较大亏损。这需要设置止损位控制风险敞口。
优化建议
该策略可从以下几个维度进行优化:
1.加入自适应SMA。让SMA周期数值根据市场波动率和交易次数动态变更,可提高策略稳健性。
2.设置复利次数优化策略,即通过设置盈利次数来实现指数增长。适当保留部分利润再投入下次交易。
3.引入机器学习模型判定买卖时机。收集历史数据训练模型,辅助判断未来价格变化方向。
总结
该动态加权移动平均线策略,运用快速慢速SMA设计实现对短期价格捕捉。引入EMA对趋势进行判断,并辅以颜色渲染直观反映多空状态。相较于传统策略,其弹性设计使之更适应加密货币等高波动市场。加入止损和参数优化后,可望获取较为稳定收益。
/*backtest
start: 2022-12-14 00:00:00
end: 2023-12-20 00:00:00
period: 1d
basePeriod: 1h
exchanges: [{"eid":"Futures_Binance","currency":"BTC_USDT"}]
*/

//@version=5
strategy("Estrategia Mejorada para Criptomonedas", overlay=true)

// Variables de estrategia
var bool longCondition = na
var bool shortCondition = na

// Indicadores
emaValue = ta.ema(close, 30)
smaFast = ta.sma(close, 5)  // Período más corto para mayor sensibilidad
smaSlow = ta.sma(close, 10)  // Período más corto para mayor sensibilidad

// Lógica de la estrategia mejorada
longCondition := ta.crossover(smaFast, smaSlow) and close > emaValue
shortCondition := ta.crossunder(smaFast, smaSlow) and close < emaValue

// Entradas de estrategia
if (longCondition)
    strategy.entry("Long", strategy.long)
if (shortCondition)
    strategy.entry("Short", strategy.short)

// Sombreado para tendencia alcista (verde)
bgcolor(longCondition ? color.new(color.green, 90) : na, title="Tendencia Alcista")

// Sombreado para tendencia bajista (rojo)
bgcolor(shortCondition ? color.new(color.red, 90) : na, title="Tendencia Bajista")

// Otros indicadores o filtros pueden ser agregados aquí

// Visualización de indicadores originales
plotColor = close > open ? color.green : color.red
plot(emaValue, color=plotColor, linewidth=2, title="EMA (30)")
value = 10 * open / close
plotColor2 = close == open ? color.orange : color.blue
plot(value, color=plotColor2, linewidth=2, title="Valor Relativo")

// Visualización de medias móviles
plot(smaFast, color=color.blue, title="SMA Rápida (5)", linewidth=2)
plot(smaSlow, color=color.red, title="SMA Lenta (10)", linewidth=2)