概述
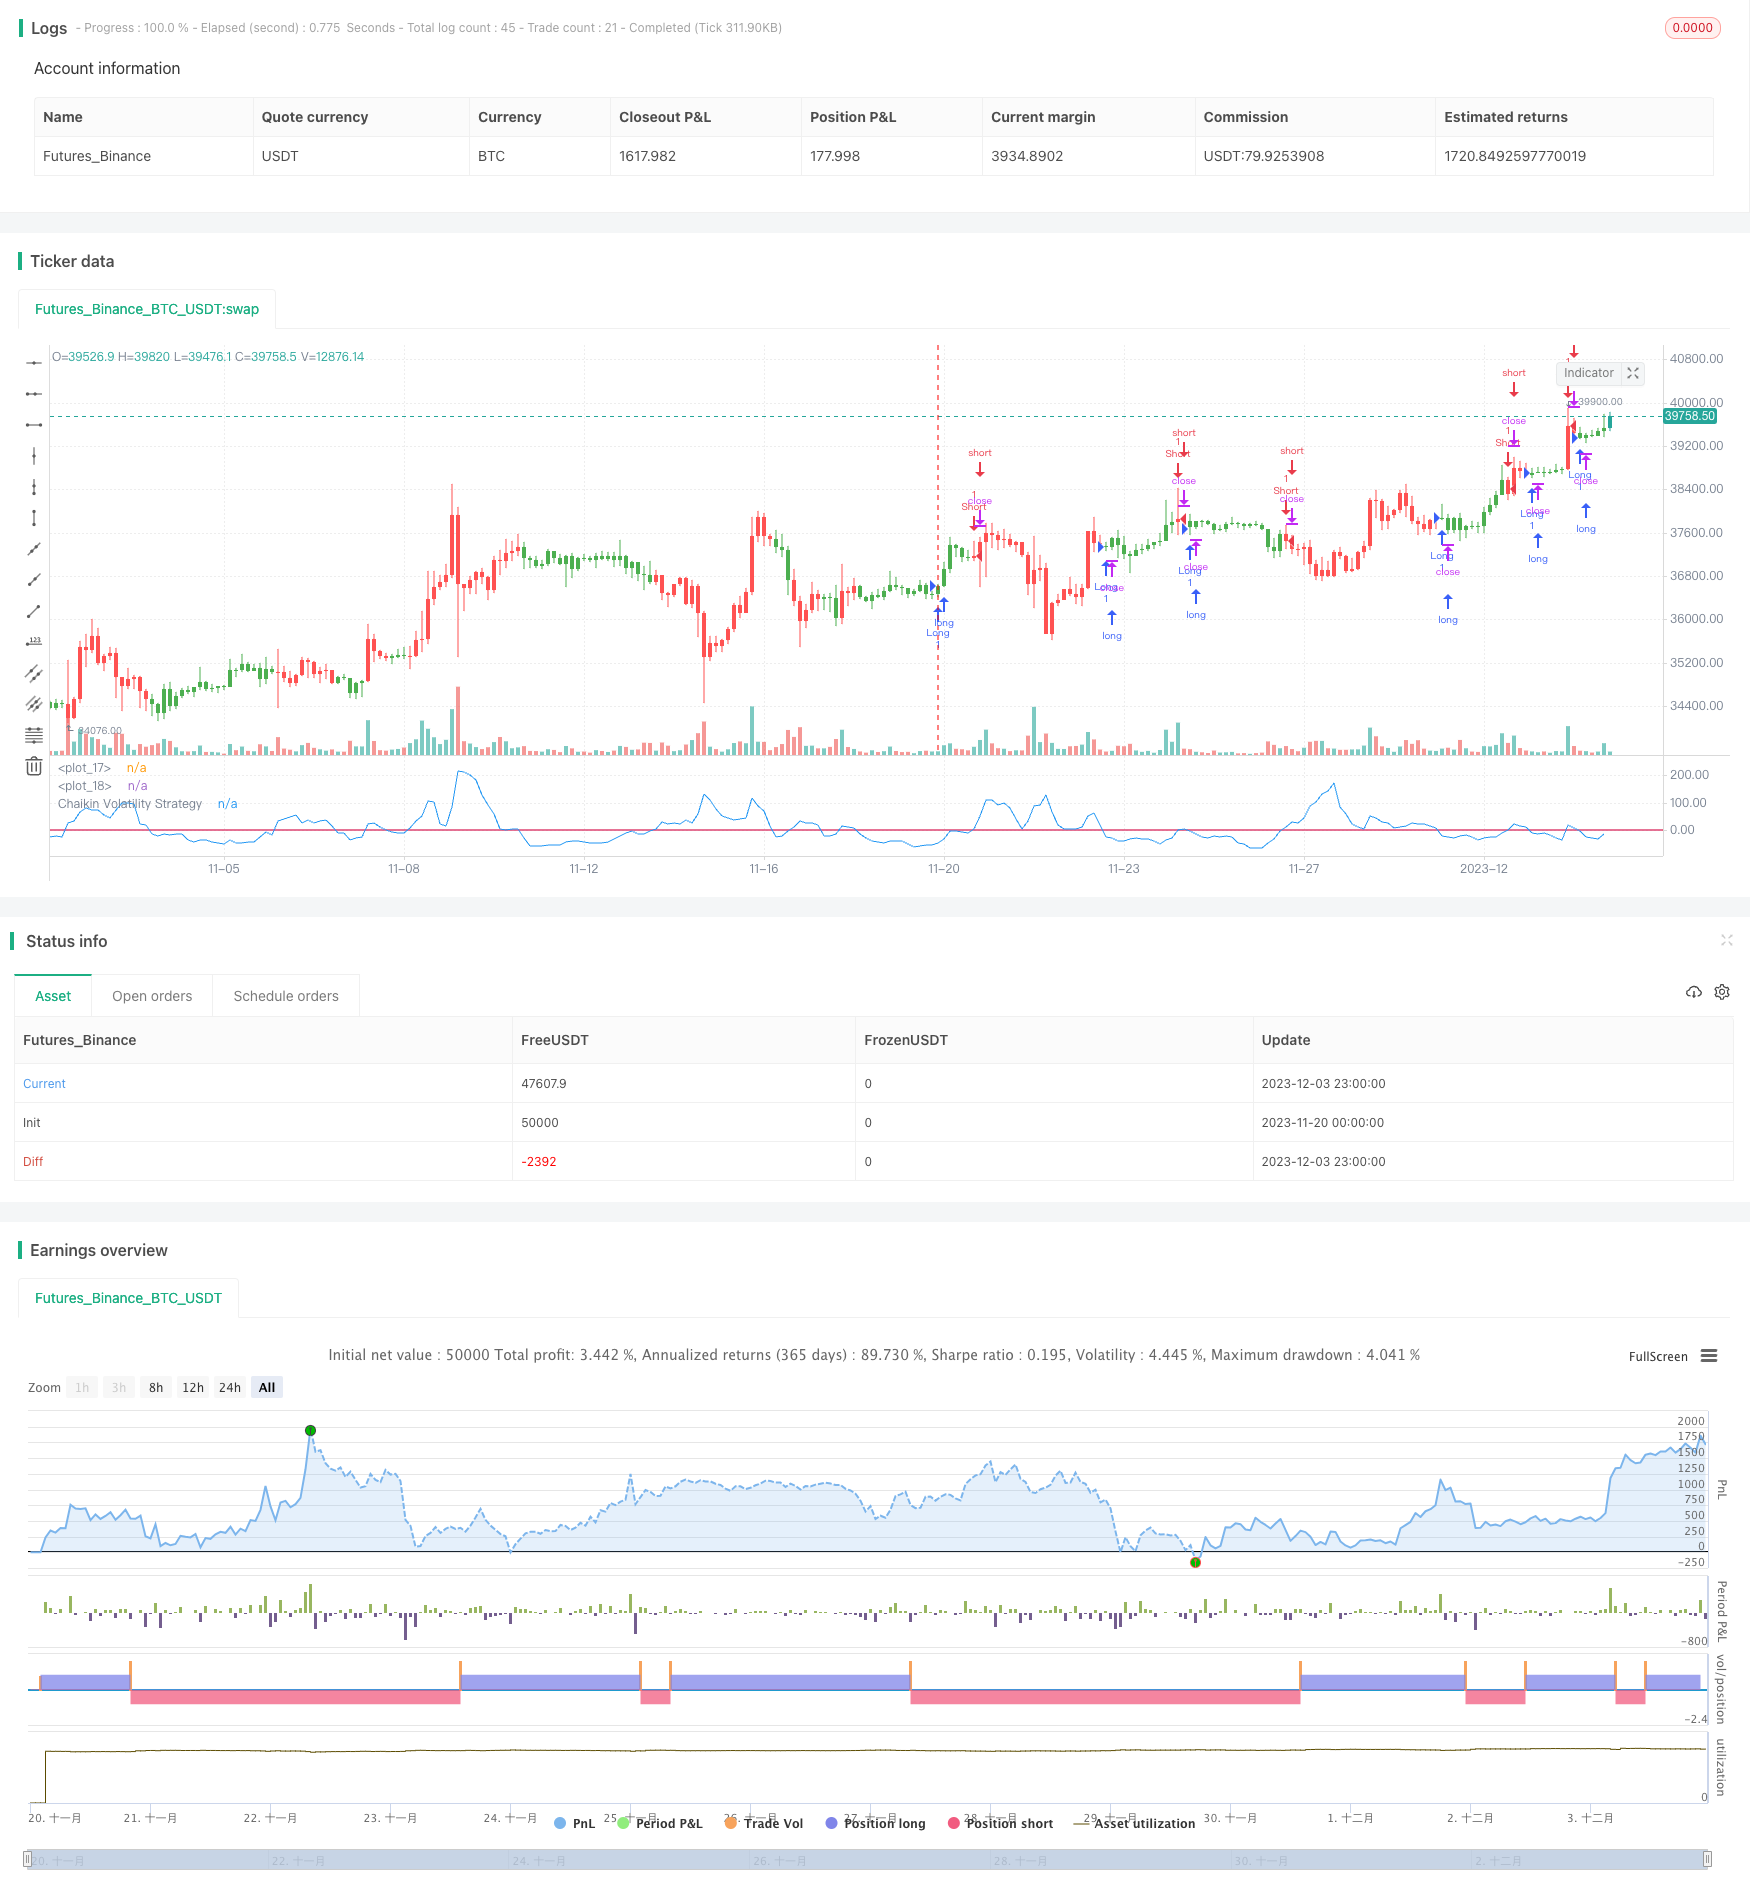
本策略基于柴金波动率指标设计了一个短线交易系统,主要用于捕捉市场的短线波动。该策略的主要思路是当柴金波动率指标上穿或下穿指定阈值时,进行买入或卖出操作。
策略原理
柴金波动率指标是通过计算证券的最高价和最低价的范围来量化衡量波动率。当最高价和最低价的差值扩大时,表示波动率上升。
本策略的具体逻辑是:
- 计算柴金波动率指标(xROC_EMA)
- 设置一个触发阈值(Trigger)
- 当xROC_EMA上穿Trigger时,做多;当xROC_EMA下穿Trigger时,做空
- 可以选择是否交易反向
策略优势分析
本策略具有以下优势:
- 响应迅速,适合短线操盘
- 回撤相对较小,具有一定的资金管理效果
- 实现简单,容易理解
- 可以灵活调整参数,适应不同市场环境
风险分析
本策略也存在一定的风险:
- 短线交易带来较高的交易频率,存在过度交易的风险
- 设置的参数如Length、Trigger等容易过拟合
- 交易反转时容易形成亏损
- 无法有效过滤市场噪音,存在一定的误交易概率
对应风险的解决方法如下:
- 适当调整参数,控制交易频率
- 优化参数设置,防止过拟合
- 适当宽松止损,给予价格一定的回调空间
- 结合其他指标进行过滤,减少误交易
策略优化方向
本策略可以从以下方面进行优化:
- 结合市场结构指标,识别趋势和关键支撑位
- 增加过滤条件,减少whipsaw,例如加入量能指标、移动平均线等
- 动态调整参数,使之能根据市场环境变化而变化
- 优化止损机制,如采用追踪止损或Chandelier Exit等,以锁定更多利润
总结
本策略整体思路清晰简洁,具有短线操盘特点。参数设置灵活,可根据需要调整。同时也存在一些参数易过拟合和交易频率过高的风险。通过进一步优化,可使策略 parameter robustness 更强,从而获得更稳定的表现。
策略源码
/*backtest
start: 2023-11-20 00:00:00
end: 2023-12-04 00:00:00
period: 3h
basePeriod: 15m
exchanges: [{"eid":"Futures_Binance","currency":"BTC_USDT"}]
*/

//@version = 2
////////////////////////////////////////////////////////////
//  Copyright by HPotter v1.0 01/12/2016
// Chaikin's Volatility indicator compares the spread between a security's
// high and low prices. It quantifies volatility as a widening of the range
// between the high and the low price.
// You can use in the xPrice1 and xPrice2 any series: Open, High, Low, Close, HL2,
// HLC3, OHLC4 and ect...
// You can change long to short in the Input Settings
// Please, use it only for learning or paper trading. Do not for real trading.
///////////////////////////////////////////////////////////
strategy(title="Chaikin Volatility Strategy Backtest")
Length = input(10, minval=1)
ROCLength = input(12, minval=1)
Trigger = input(0, minval=1)
reverse = input(false, title="Trade reverse")
hline(0, color=purple, linestyle=line)
hline(Trigger, color=red, linestyle=line)
xPrice1 = high
xPrice2 = low
xPrice = xPrice1 - xPrice2
xROC_EMA = roc(ema(xPrice, Length), ROCLength)
pos = iff(xROC_EMA < Trigger, 1,
	   iff(xROC_EMA > Trigger, -1, nz(pos[1], 0)))
possig = iff(reverse and pos == 1, -1,
         iff(reverse and pos == -1, 1, pos))
if (possig == 1)
    strategy.entry("Long", strategy.long)
if (possig == -1)
    strategy.entry("Short", strategy.short)
barcolor(pos == -1 ? red: pos == 1 ? green : blue )
plot(xROC_EMA, color=blue, title="Chaikin Volatility Strategy")