资源加载中... loading...

Turtle-trend Following Strategy

Author: ChaoZhang, Date: 2023-12-22 11:41:30
Tags:

img

Overview

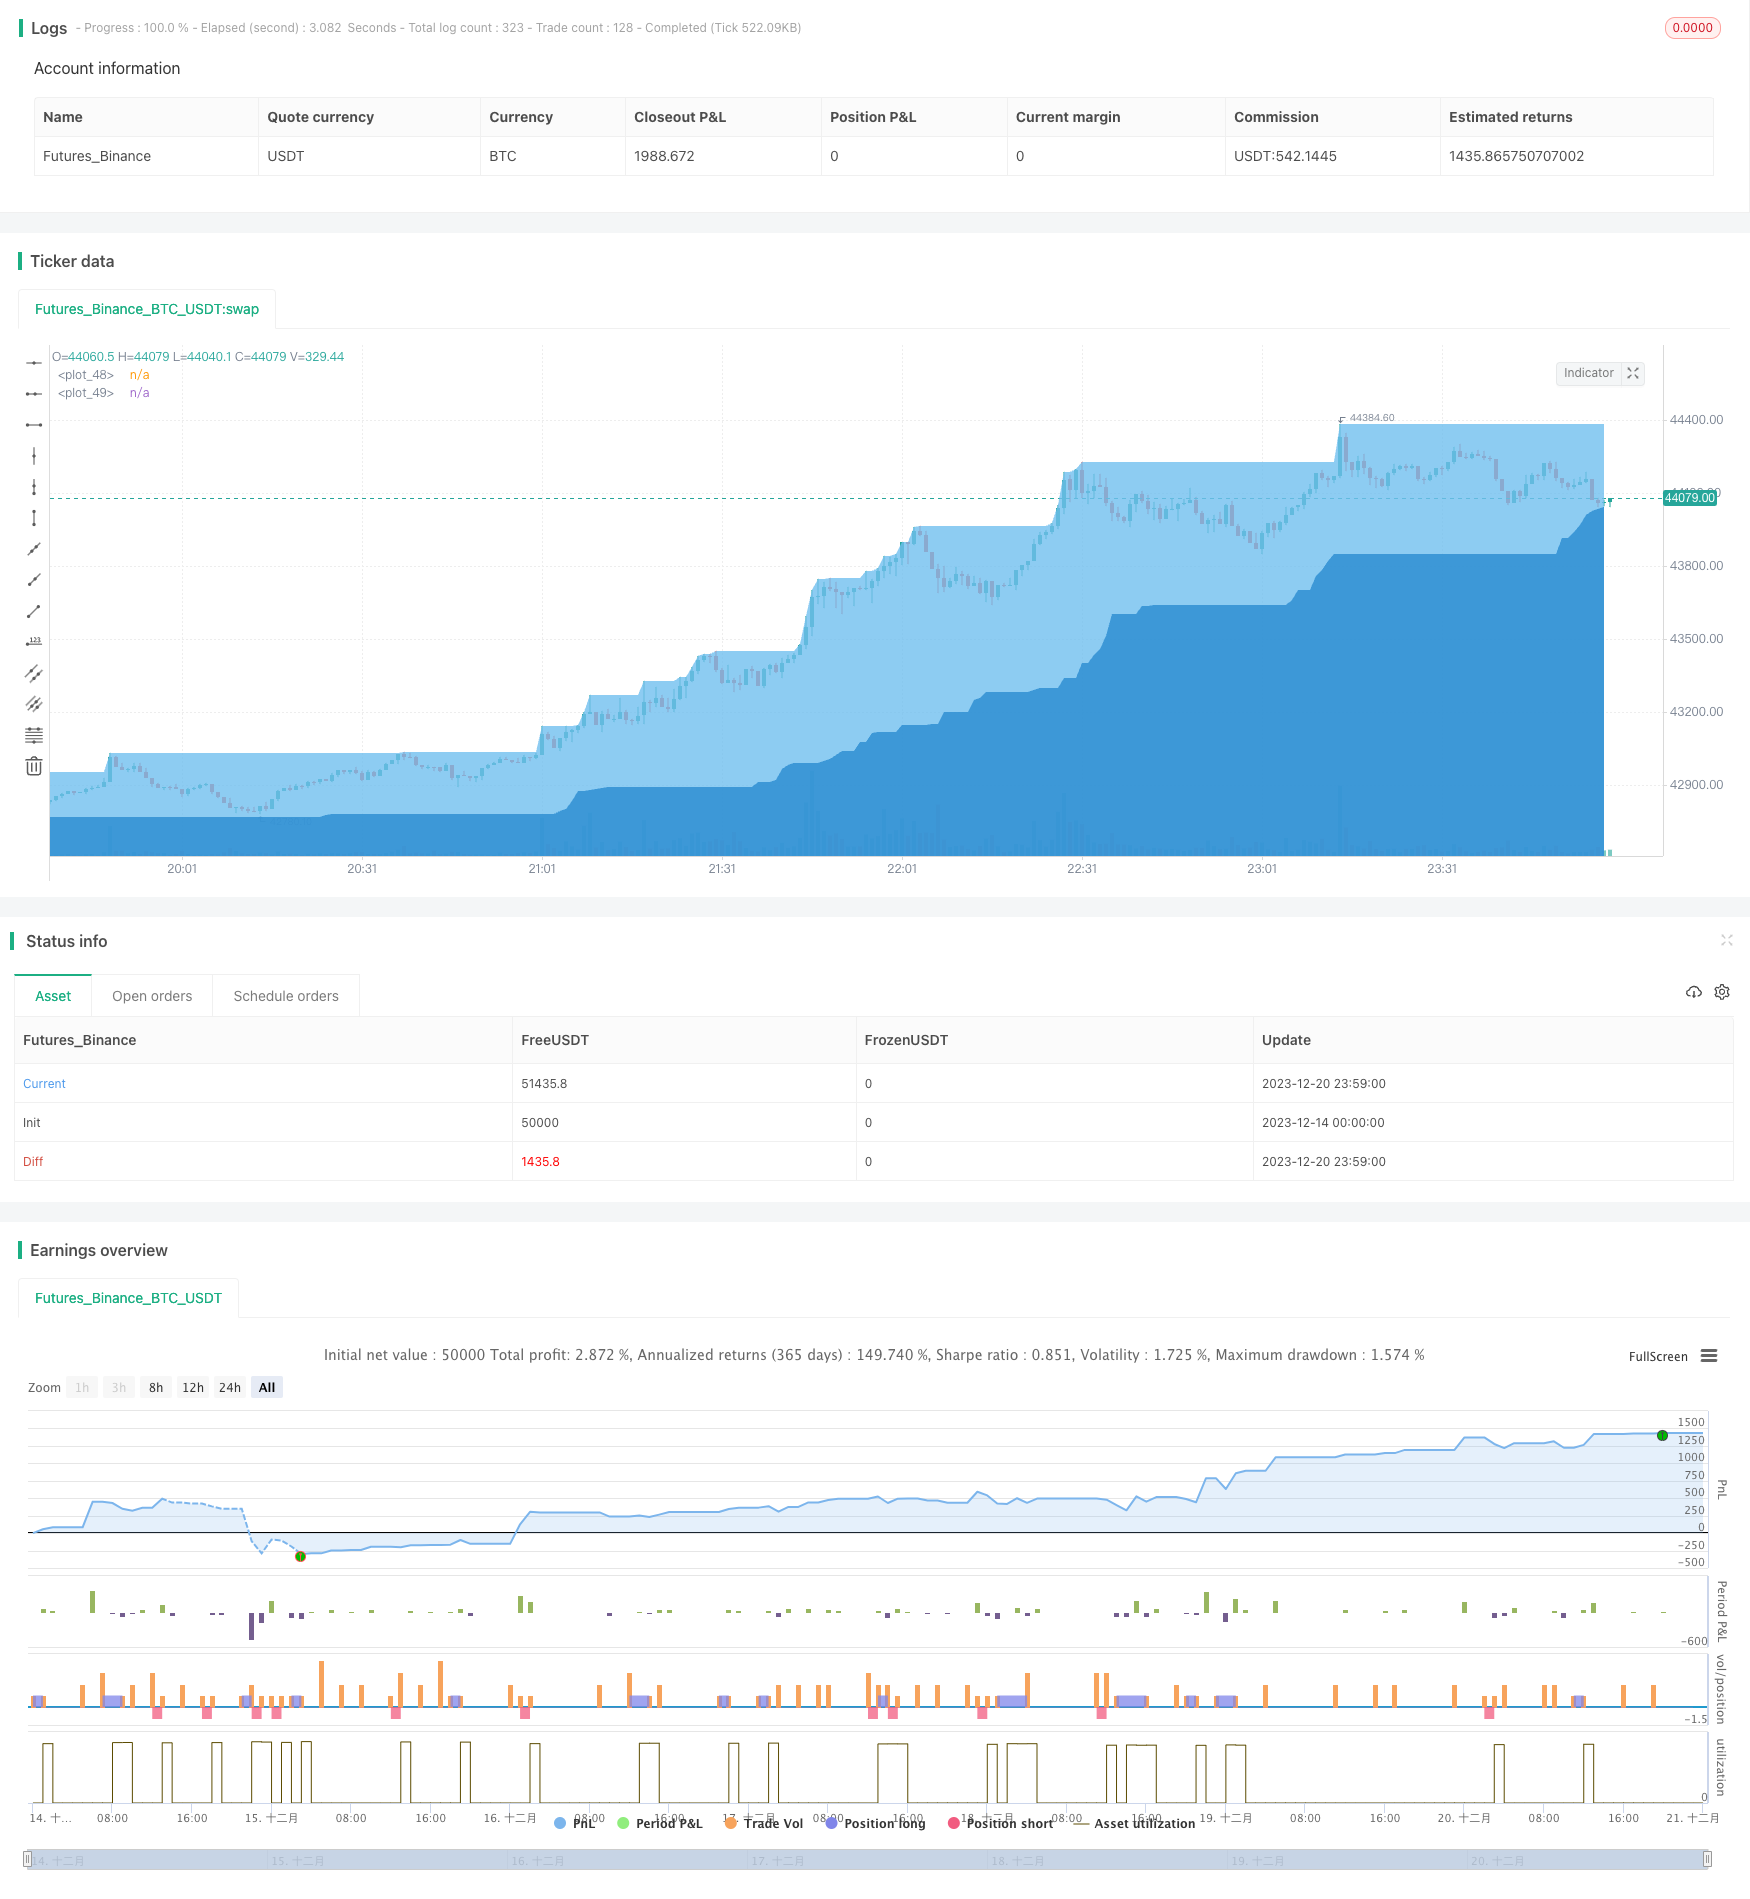
The turtle-trend following strategy is a quantitative strategy that determines the trend direction based on moving averages and trades at trend reversal points. The strategy also combines candlestick patterns to determine signals and enter and stop loss at potential reversal points.

Strategy Principle

The strategy uses three EMA lines of different cycles to determine the trend direction. Specifically, the 15-day, 120-day, and 220-day EMA lines are calculated. When the 15-day line is higher than the 220-day line, the uptrend is determined. When the 15-day line is lower than the 220-day line, the downtrend is determined.

When in an uptrend, if the closing price is below the 220-day line, go short; when in a downtrend, if the closing price is above the 220-day line, go long.

At the same time, the strategy also combines candlestick patterns to confirm signals. When there is a bullish big gap candlestick or a bearish big gap candlestick, the position is closed to stop loss.

Advantage Analysis

The biggest advantage of this strategy is that it can follow the trend to operate, avoiding reverse operations without clear signals. By judging the trend with multiple moving averages, market noise can be effectively filtered to lock the main trend direction.

At the same time, the strategy will also enter at potential trend reversal points, which has very good risk-reward characteristics at this time. And combining candlesticks to stop loss can avoid too fragmented stop loss points.

Risk Analysis

The main risk of this strategy is that the trend determined by the moving average may lag behind the actual price movement. At this time, reverse operations against the trend may occur.

In addition, the candlestick patterns used in the strategy may also fail and cannot stop loss effectively. When there is abnormal market fluctuation, the stop loss point may be directly penetrated, resulting in greater losses.

To reduce the above risks, consider adjusting the cycle parameters of the moving average, or adjusting the proportional factor for determining the candlestick pattern to make the rules stricter. Of course, it also needs to be aware that technical analysis can never completely avoid market risk, and position size needs to be controlled.

Optimization Directions

The strategy can be optimized in the following aspects:

  1. Optimize the cycle parameters of the moving average to find a more suitable combination of parameters to judge the trend

  2. Test different types of moving average indicators, such as SMA, LWMA, etc., to find indicators that match your own style

  3. Adjust or add candlestick judgment rules to make reversal signals clearer and more reliable

  4. Add stop loss strategies, such as trailing stop loss, time stop loss, etc., to further control single loss

  5. Combine other indicators, such as volatility indicators, trading volume, etc., to enrich the trading signals of the system

Summary

The turtle-trend following strategy is a very typical trend following strategy overall. Its method of judging the trend is simple and easy to implement, while also having certain risk control measures. This strategy is suitable for investors who have some understanding of trend trading and hope to obtain stable returns. If continuously optimized, it can also become a quantitative strategy with long-term competitive advantages.


/*backtest
start: 2023-12-14 00:00:00
end: 2023-12-21 00:00:00
period: 1m
basePeriod: 1m
exchanges: [{"eid":"Futures_Binance","currency":"BTC_USDT"}]
*/

// © Aayonga 
//@version=5
strategy('帆船探险寻找传说', overlay=true)

useDateFilter=input.bool(true,title = "启用回测时间范围限定", group = "回测范围")
backtesStarDate=input(timestamp("1 Jan 2015"),title = "开始时间", group = "回测范围")
backtestEndDate=input(timestamp("1 Jan 2040"),title = "结束时间",group = "回测范围")
inTradeWindow= true


A = input(50, '计算的周期')


shallowsea = ta.highest(A)
deepsea= ta.lowest(A)

//趋势形成条件
Length1 = input.int(15, title='短期市场平均成本', minval=1, group='市场平均成本')
Length2 = input.int(120, title='中期市场平均成本', minval=1, group='市场平均成本')
Length3 = input.int(220, title='长期市场平均成本', minval=1, group='市场平均成本')
SMA1 = ta.ema(close, Length1)
SMA2 = ta.sma(close, Length2)
SMA3 = ta.sma(close, Length3)


//趋势看多
longTrend=SMA1>SMA3 and open >SMA3 

shortTrend=SMA1<SMA3 

bullPinBar = ((close > open) and ((open - low) > 0.66* (high - low))) or ((close < open) and ((close - low) > 0.9 * (high - low)))
bearPinBar = ((close > open) and ((high - close) > 0.75 * (high - low))) or ((close < open) and ((high - open) >0.9 * (high - low)))


if close > shallowsea[5] and shortTrend and inTradeWindow
    strategy.entry('⛵🎏', strategy.short)

if close < deepsea[5] and longTrend and inTradeWindow
    strategy.entry('🧜', strategy.long)

if  bullPinBar and inTradeWindow
    strategy.close('⛵🎏',comment = '🐚')

if bearPinBar and inTradeWindow
    strategy.close('🧜',comment = '🐳')

plot(shallowsea,style=plot.style_area, color=color.new(#71bfef, 0))
plot(deepsea, style=plot.style_area,color=color.new(#298bd1, 0))


template: strategy.tpl:40:21: executing "strategy.tpl" at <.api.GetStrategyListByName>: wrong number of args for GetStrategyListByName: want 7 got 6