概述
云霓双重均线突破策略是一个利用快速均线和慢速均线组成双云进行突破交易的策略。该策略同时具有趋势跟踪和反转交易的特点。
策略原理
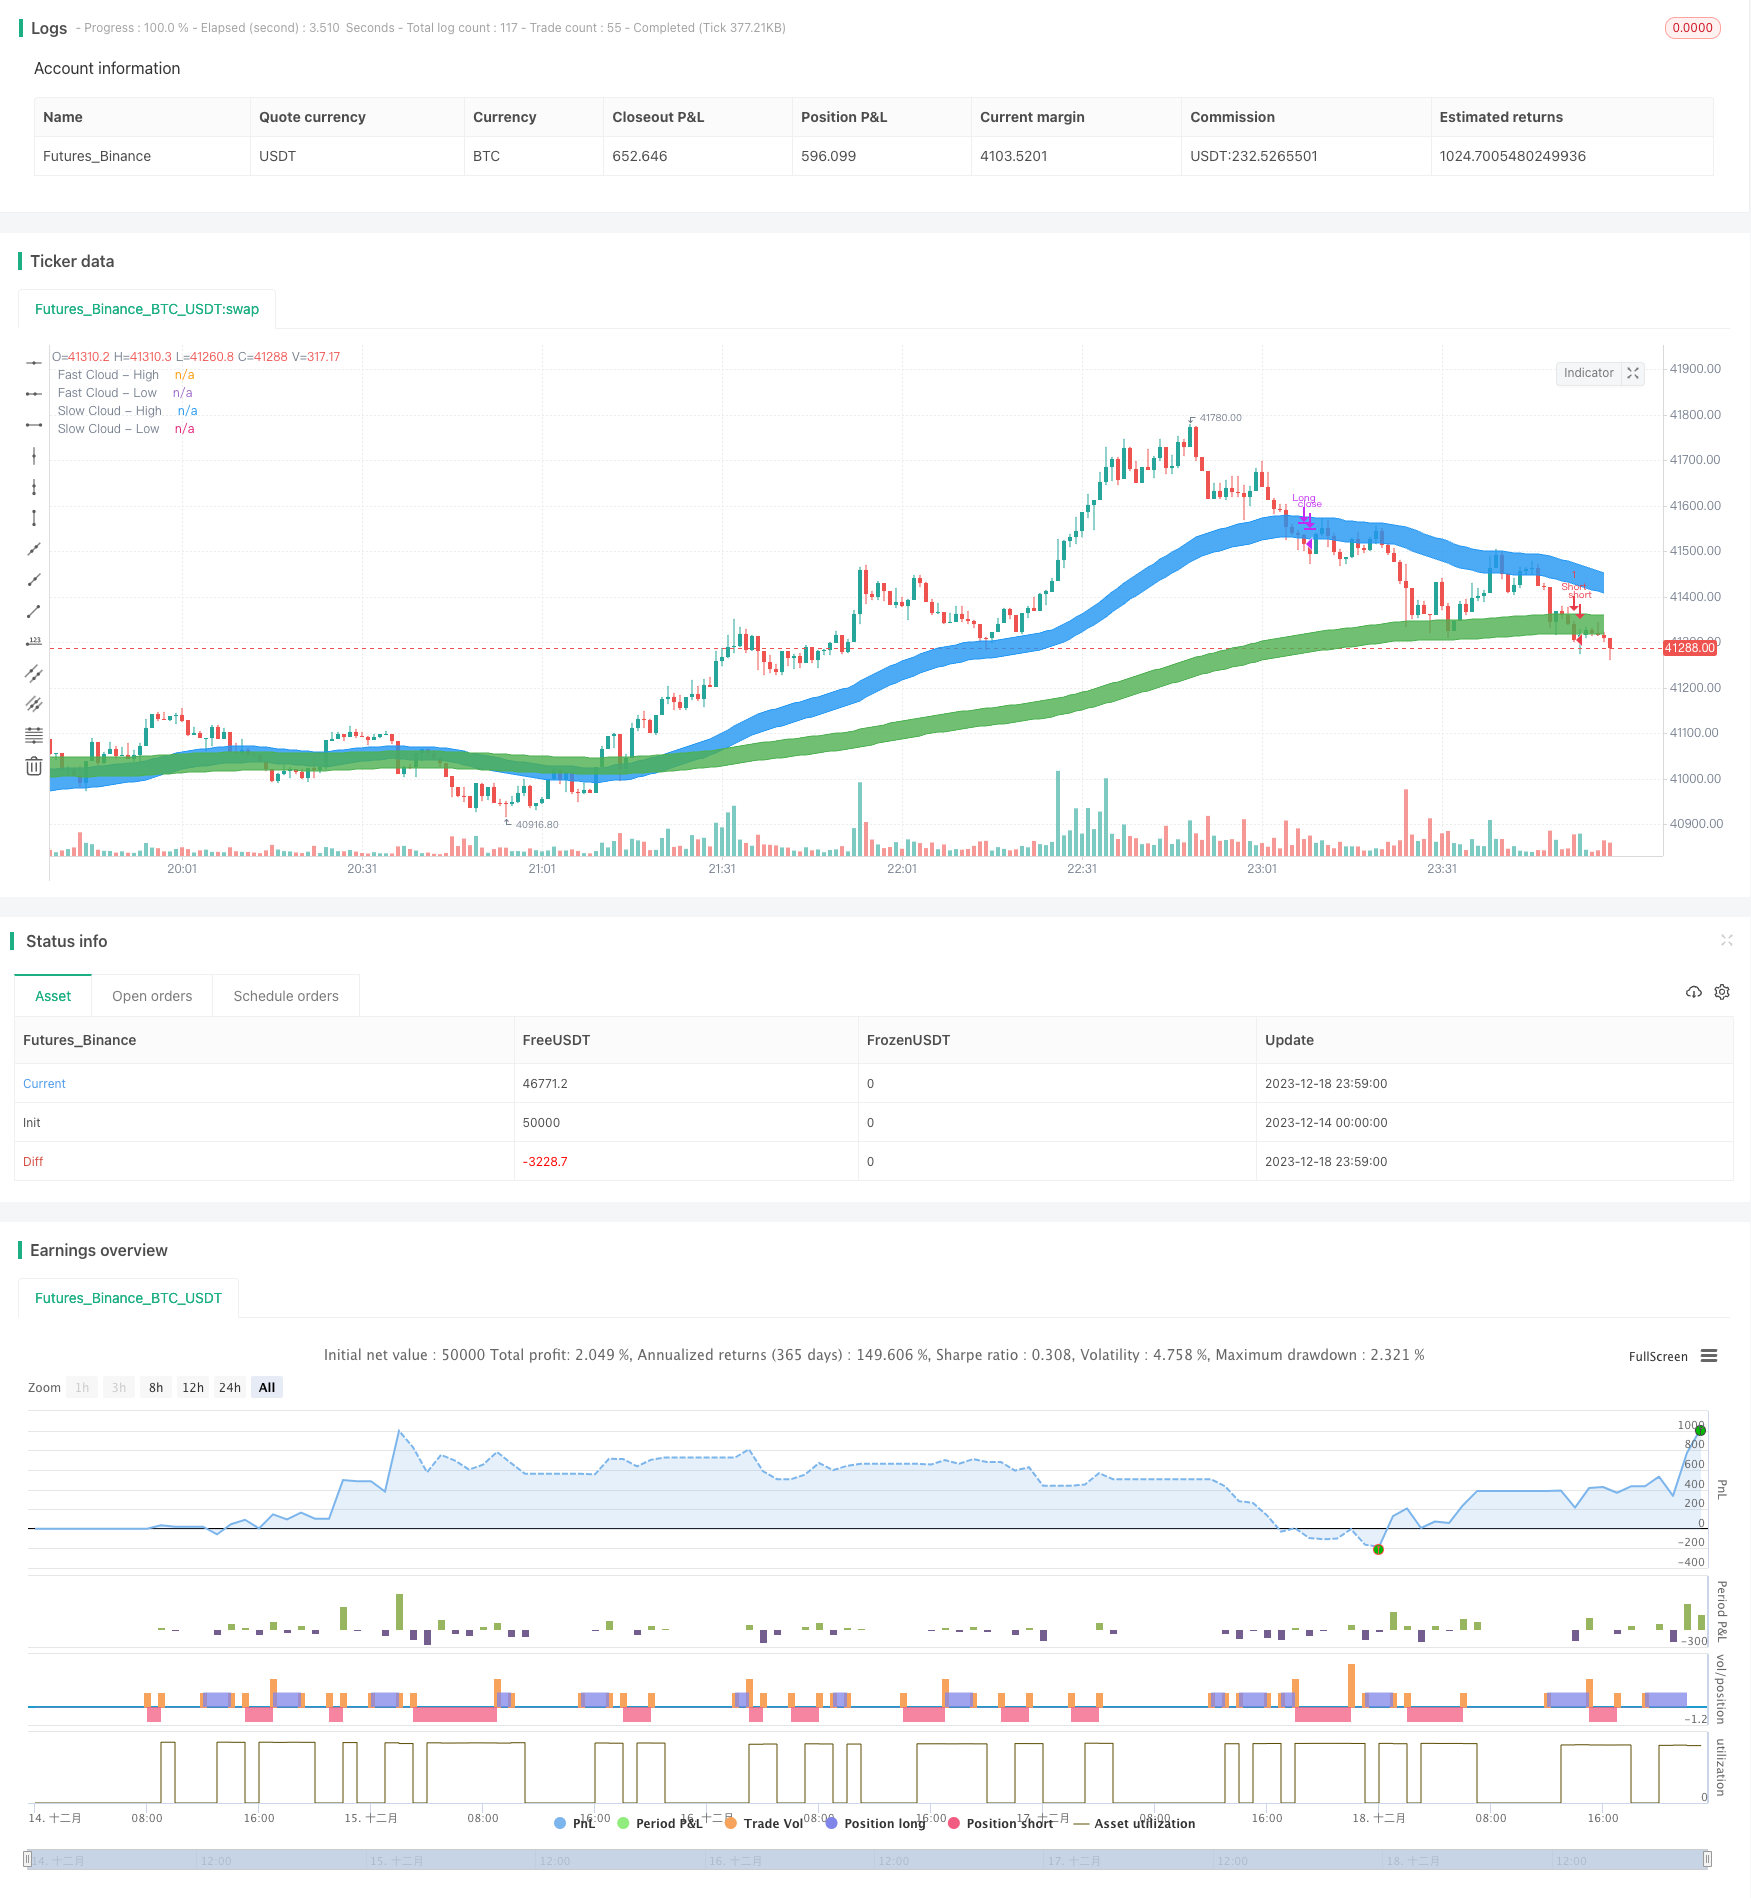
该策略通过计算60周期的高低价EMA作为快速云,240周期的高低价EMA作为慢速云。当快速云完全低于慢速云时,做多;当快速云完全高于慢速云时,做空。具体入场规则是价格突破慢速云的上沿或下沿时机会入场,止损设在5日内最高最低价,止盈设在价格突破快速云的上沿或下沿时离场。
该策略同时具有趋势跟踪和反转交易两个特点。当市场处于震荡时,快速云和慢速云发生对折是做反转的时机;当快速云和慢速云平行时,跟随趋势做趋势交易。
优势分析
双云结构可以有效判断市场趋势,利用双云间的上下交叉做反转交易,大幅提高胜率。
双云结构中快速云和慢速云发生分离是市场变化的信号,这为我们提供了潜在机会。
利用云间交叉和价格对云的突破,使策略同时具有趋势跟随和反转交易的特点,兼顾了操作频率和胜率。
采用云沿作为止损止盈点,可以很好控制风险。
风险分析
价格剧烈波动时,快慢云可能发生频繁交叉,导致多次调仓亏损。
该策略更适合震荡盘整的市场环境。趋势盘市场中,快慢云平行情况较多,容易被套牢。
在盘整期内,缺乏有效跟随趋势的方法,无法把握盘整后可能出现的大涨大跌机会。
优化方向
可在双云发生交叉之前加入价格通道和成交量的判断,避免价格剧烈波动造成的虚假信号。
可加入趋势判断指标,对快慢云出现上下分离时,判断大趋势方向选择性参与反转交易。
可设置快速云宽度的自适应算法,在震荡和趋势两个市场环境中找到最佳参数组合。
总结
云霓双重均线突破策略综合运用快速均线和慢速均线的优势,构建双云系统进行反转和趋势交易。它兼具操作频率与胜率平衡的特点,能够有效把握市场的变化节奏。通过加入辅助判断指标与参数优化,可进一步扩大策略优势,使其更好适应复杂多变的市场环境。
策略源码
/*backtest
start: 2023-12-14 00:00:00
end: 2023-12-19 00:00:00
period: 1m
basePeriod: 1m
exchanges: [{"eid":"Futures_Binance","currency":"BTC_USDT"}]
*/

// High Low Cloud Strategy Backtesting
// © inno14

//@version=4
strategy(title="High Low Cloud Strategy Backtesting", overlay=true, pyramiding=0)
c1=input(60, title="Fast Cloud Length")
c2=input(240, title="Slow Cloud Length")
c1_high=ema(high,c1)
c1_low=ema(low,c1)
highc1=plot(c1_high, title="Fast Cloud - High", color=color.blue, offset=0, transp=50, linewidth=1)
lowc1=plot(c1_low, title="Fast Cloud - Low", color=color.blue, offset=0, transp=50, linewidth=1)
fill(highc1, lowc1, transp=60, color=color.blue, title="Fast Cloud")
c2_high=ema(high,c2)
c2_low=ema(low,c2)
highc2=plot(c2_high, title="Slow Cloud - High", color=color.green, offset=0, transp=50, linewidth=1)
lowc2=plot(c2_low, title="Slow Cloud - Low", color=color.green, offset=0, transp=50, linewidth=1)
fill(highc2, lowc2, transp=40, color=color.green, title="Slow Cloud")
//Backtesting
//Long condition
ycloud_entry=
       c1_high<c2_low
       and crossover(close,c2_high)


ycloud_stoploss=
       crossunder(close,valuewhen(ycloud_entry,lowest(close[1],c2),0))

ycloud_takeprofit=
      c1_low>c2_high
      and crossunder(close,c1_low)


strategy.entry("Long", strategy.long, when=ycloud_entry)
strategy.close("Long", when=ycloud_takeprofit or ycloud_stoploss)

//Short condition
xcloud_entry=
       c1_low>c2_high
       and crossunder(close,c2_low)

xcloud_stoploss=
       crossover(close,valuewhen(xcloud_entry,highest(close[1],c2),0))

xcloud_takeprofit=
       c1_high<c2_low
       and crossover(close,c1_high)

strategy.entry("Short", strategy.short, when=xcloud_entry)
strategy.close("Short", when=xcloud_takeprofit or xcloud_stoploss)


//EOF