概述
该策略通过布林带指标判断市场趋势方向,结合RSI指标过滤阳离子信号,实现追涨杀跌的动量突破操作。其基本思路是:当价格突破布林带上轨时看涨入场,当价格突破布林带下轨时看跌入场。
策略原理
布林带指标判断价格突破上轨时,表示市场进入看涨行情,这时用RSI指标过滤,RSI大于60时产生买入信号;布林带指标判断价格突破下轨时,表示市场进入看跌行情,这时用RSI指标过滤,RSI小于40时产生卖出信号。
入场后设置止损,避免亏损扩大。
出场条件为价格重新跌破布林中轨时平买单,价格重新涨破布林中轨时平卖单。
优势分析
布林带指标可以判断市场主要趋势,捕捉行情转折点。结合RSI指标过滤可以提高信号的可靠性。
追涨杀跌的操作方式可以实现超额收益。
设置止损点可以控制风险。
风险分析
布林带指标对于盘整行情判断效果不佳,容易产生假信号。
止损点设置不当可能造成亏损扩大。
交易频繁,易受交易费用和滑点的影响。
突破信号判断需要及时更新,否则可能错过最佳入场时机。
优化方向
结合其他指标判断布林带指标突破信号的可靠性。例如成交量,移动平均线等。
动态调整布林带参数,优化指标性能。
优化止损位置。如跟踪止损,百分比止损等方法。减少无谓损失。
总结
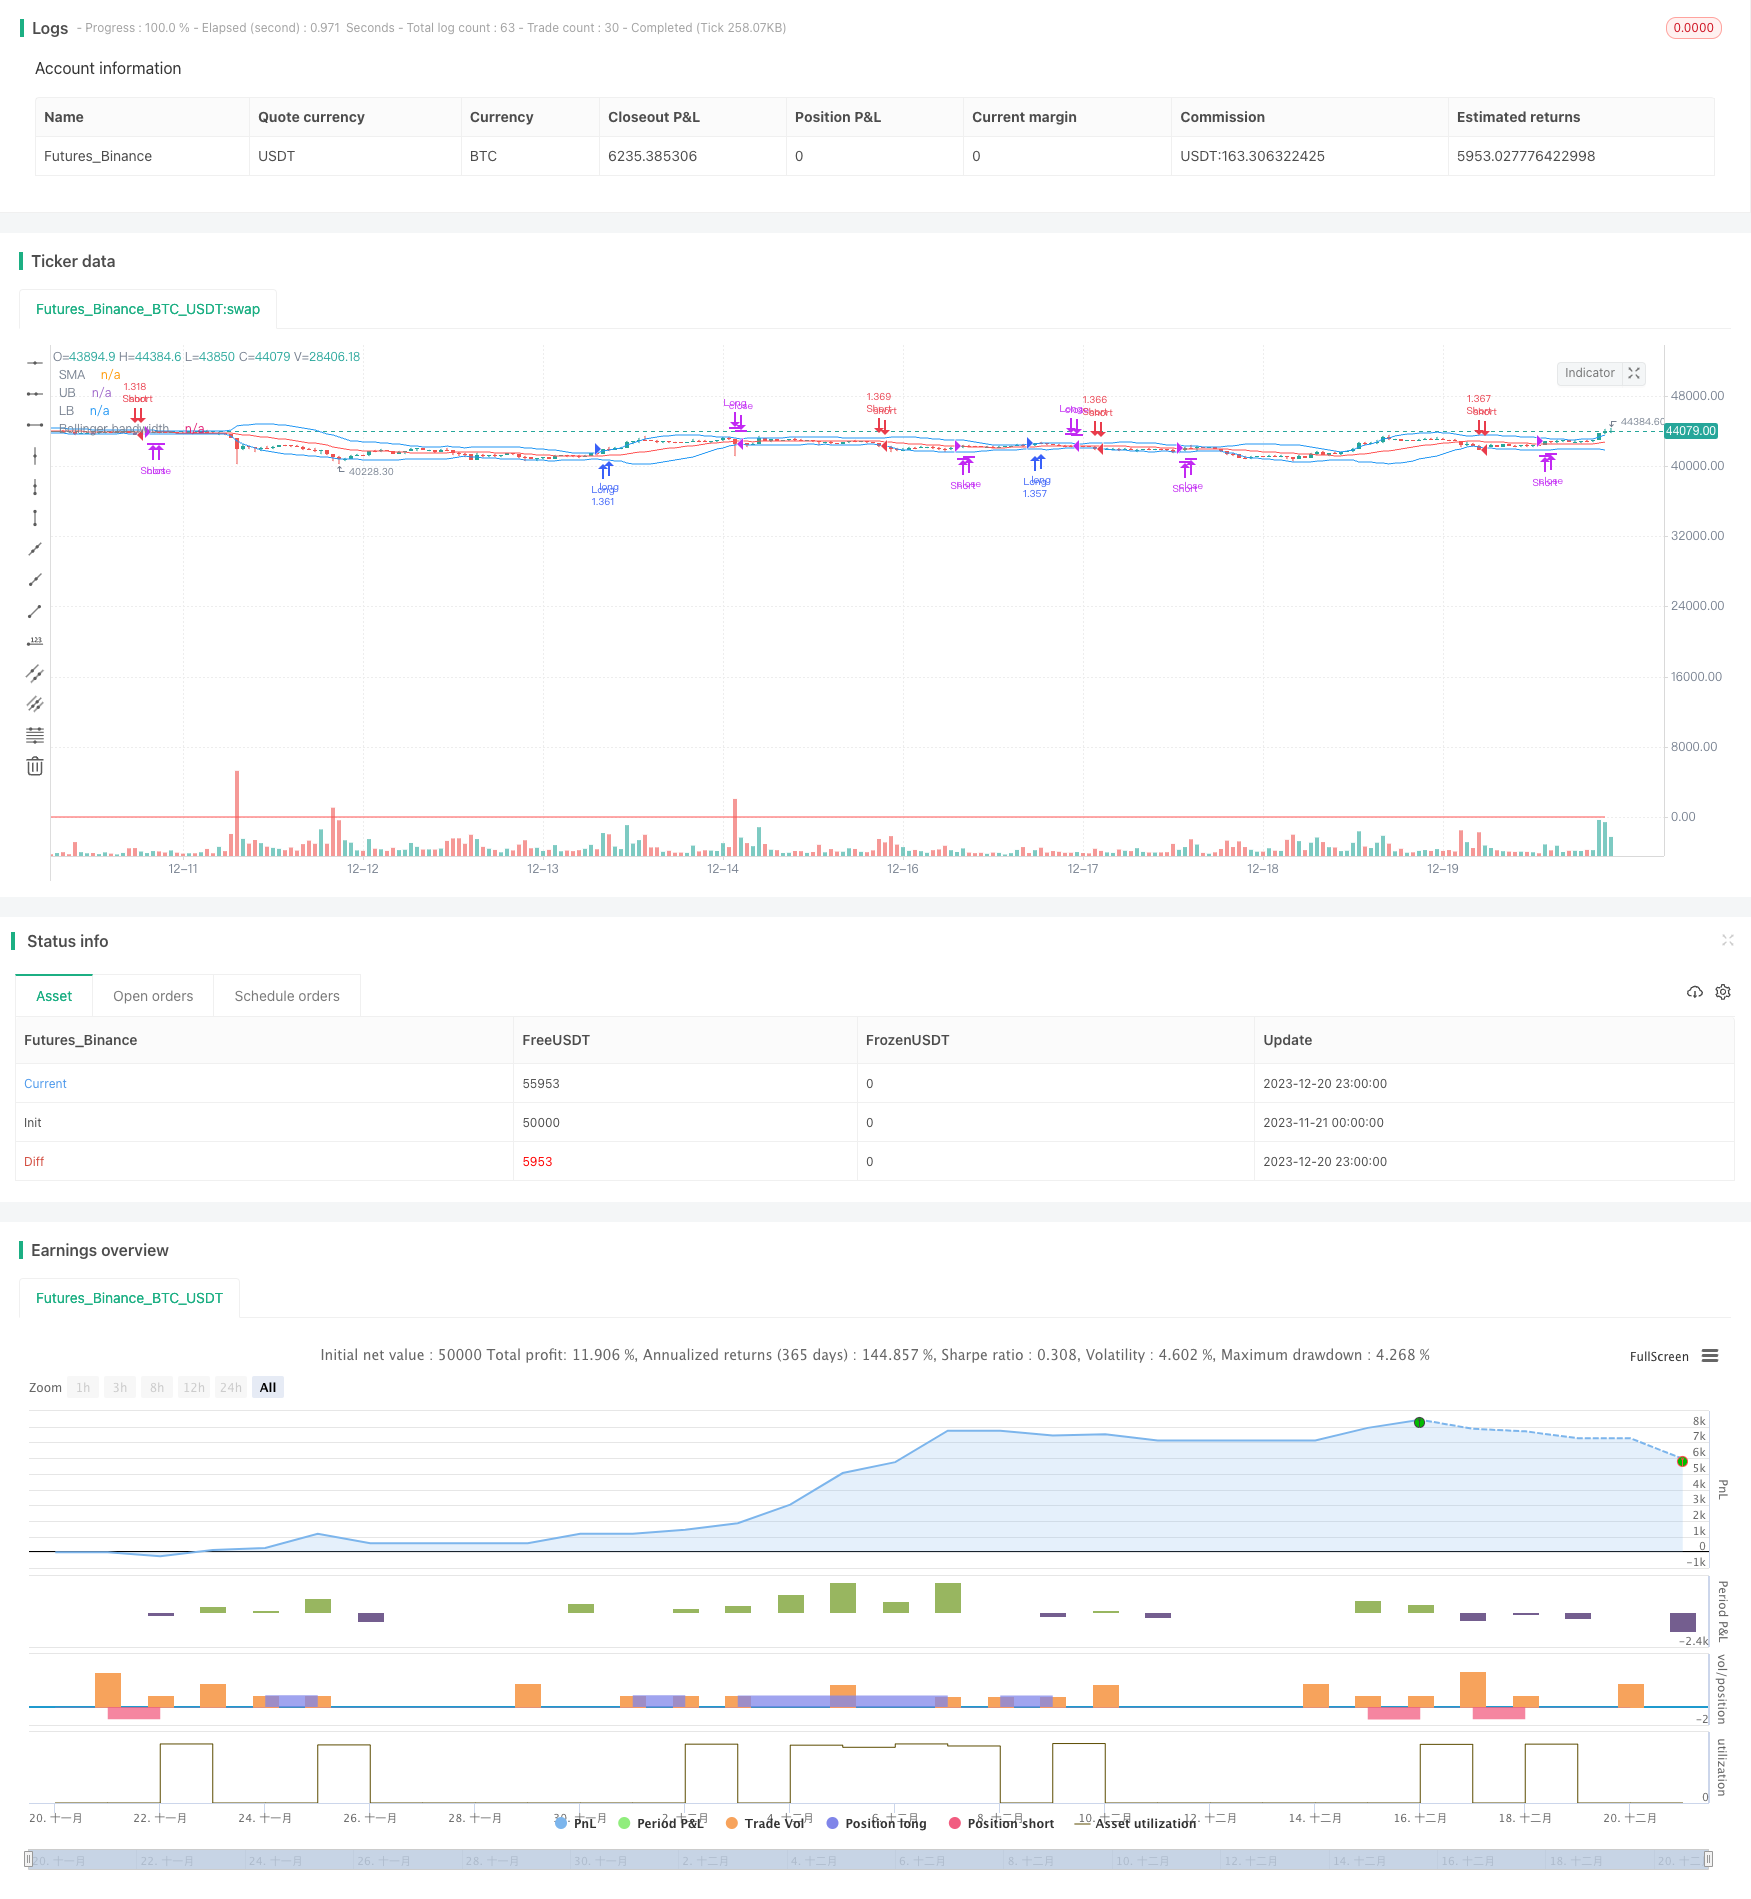
该策略整体思路清晰,通过布林带判断市场趋势和RSI指标过滤,实现动量式的趋势追踪。具有如下特点:操作频繁,盈亏快速,追求超额收益的交易者比较适合。但交易频繁也增加了交易成本,对资金管理和心态控制要求较高。通过参数优化,止损策略优化,可以进一步提高策略的稳定性和盈利能力。
策略源码
/*backtest
start: 2023-11-21 00:00:00
end: 2023-12-21 00:00:00
period: 1h
basePeriod: 15m
exchanges: [{"eid":"Futures_Binance","currency":"BTC_USDT"}]
*/


//@version=4
strategy(title="Bollinger Band Breakout", shorttitle = "BB-Stoxguru",default_qty_type = strategy.percent_of_equity,default_qty_value = 100, overlay=true)
source = close
start = timestamp (2007, 1,1,0,0)
end = timestamp (2021,11,05,0,0)
stop_level = (high[1]-low[1])
profit_level = (high[1]-low[1])
length = input(20, minval=1, title = "Period") //Length of the Bollinger Band
mult = input(2, minval=0.001, maxval=50, title = "Standard Deviation")

basis = sma(source, length)
dev = mult * stdev(source, length)

upper = basis + dev
lower = basis - dev
band=upper-lower
stop_loss=low-atr(14)
if time >= start
// and time < end
    strategy.entry("Long", strategy.long, when = crossover(source, upper) and rsi(close,14)>=60 and rsi(close,14)<=70)
    // strategy.entry("Long", strategy.long, when = crossover(source, upper) and rsi(close,14)>60 and band<200)
    // strategy.exit("SL", "Long", stop=stop_loss)
    strategy.close(id="Long", when=crossunder(close, basis))
    strategy.entry("Short", strategy.short, when = crossunder(source, lower) and rsi(close,14)<=40 and rsi(close,14)>=35)
    strategy.close(id="Short", when=crossover(close, basis))
    // strategy.entry("Short", strategy.short, when = crossunder(source, lower) and rsi(close,14)<40 and band<200)
    // plot(upper-lower, color=color.purple,title= "DIFF",style=plot.style_linebr)
plot(basis, color=color.red,title= "SMA")
p1 = plot(upper, color=color.blue,title= "UB")
p2 = plot(lower, color=color.blue,title= "LB")
// fill(p1, p2)
BW = ((upper - lower)) / basis * 100

plot(BW, title="Bollinger bandwidth", color=color.red)