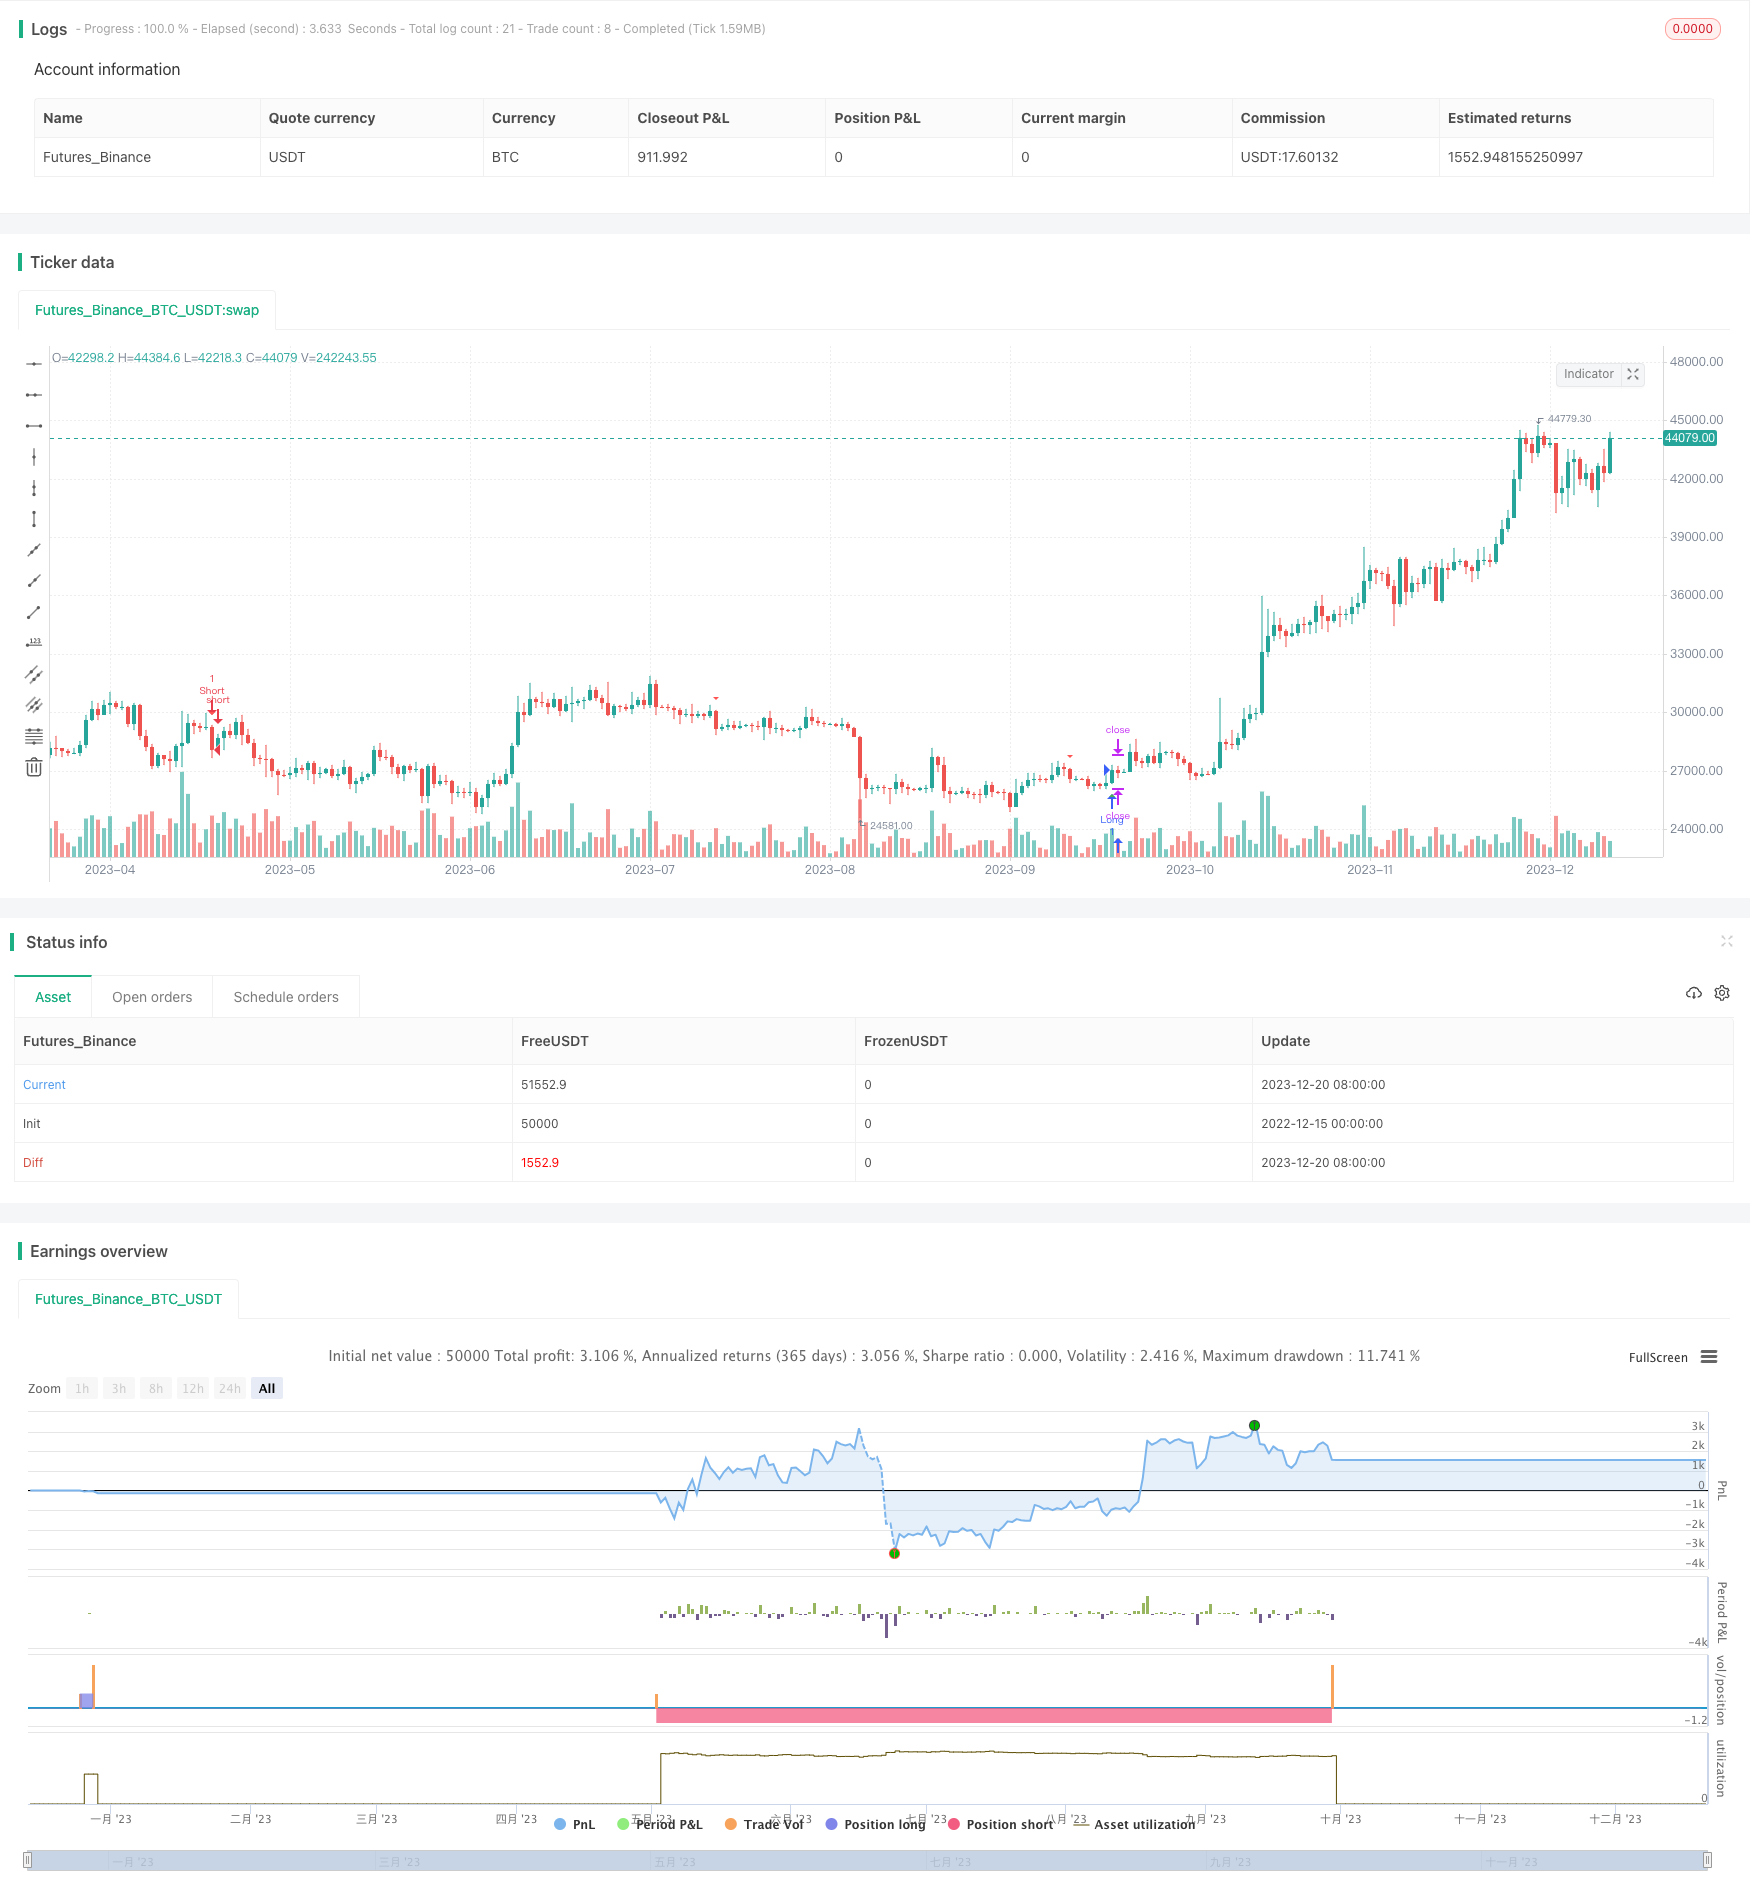
概述
均线交叉策略(Moving Average Crossover Strategy)是一种基于简单移动平均线的量化交易策略。该策略通过计算不同周期的简单移动平均线,在它们交叉时产生买入和卖出信号。
具体来说,该策略计算9日线和45日线的简单移动平均线。当价格上穿9日线和45日线时,产生买入信号;当价格下穿9日线和45日线时,产生卖出信号。
策略原理
该策略的核心逻辑基于移动平均线的“金叉死叉”原理。移动平均线能够有效地过滤市场噪音,指示大趋势的变化。当短期平均线上穿长期平均线时,表示价格开始进入上升趋势;当短期平均线下穿长期平均线时,表示价格开始进入下跌趋势。
具体来说,该策略采用9日线和45日线的简单移动平均线。9日线代表短期趋势,45日线代表长期趋势。当价格上穿9日线和45日线时,表示股价在短期和长期上都处于上升通道,因此产生买入信号;当价格下穿9日线和45日线时,表示股价的上升势头逐渐减弱,因此产生卖出信号。
从代码逻辑上看,该策略首先计算9日线和45日线的简单移动平均线,然后通过ta.crossover和ta.crossunder函数判断均线的金叉和死叉。在产生买入和卖出信号时,使用plotshape函数在K线图上绘制出三角形和倒三角形的信号图形。
此外,该策略还设定了长仓和短仓的止损逻辑。具体来说,在开仓后,会提取前一根K线的最高价和最低价作为止损价格。这能锁定盈利,避免出现超大亏损。
优势分析
- 使用双均线设定,能捕捉到中长期趋势的变化,避免被短期市场噪音影响,提高信号质量。
- 结合止损策略,可以有效控制风险,锁定盈利。
- 策略逻辑简单易懂,容易实施。
- 资金利用率高,可以进行充分复利。
风险分析
- 双均线策略容易产生死叉串thrust信号,可能导致过多无效交易。
- 止损价格设定可能过于保守,无法持续跟踪趋势行情。
- 参数选择不当可能导致交易频率过高或过低。
- 无法适应特大行情的反转。
对策: 1) 优化均线参数,降低无效交易率 2) 优化止损逻辑,采用趋势跟踪止损 3) 结合其他指标过滤信号 4) 人工干预,避免特大行情反转
优化方向
该策略还有进一步优化的空间:
使用自适应移动平均线或指数移动平均线,能更好地捕捉趋势变化。
增加波动率指标等过滤信号,避免在震荡行情中产生错误信号。
采用参数优化方法,寻找最佳的参数组合。
在止损逻辑中加入趋势跟踪机制,使止损线能够灵活跟踪价格。
增加对大级别支持阻力的判断,避免在关键价格区域产生错误信号。
结合机器学习模型进一步过滤信号质量。
总结
均线交叉策略是一种简单实用的趋势跟踪策略。它能够有效过滤噪声,捕捉价格中长期趋势的变化。结合适当的止损逻辑后,能够在控制风险的基础上进行趋势交易。该策略逻辑简单易于实施,适合量化交易的初学者开始实践。通过进一步的优化和改进,该策略可以成为量化交易体系中的一个有效组成部分。
/*backtest
start: 2022-12-15 00:00:00
end: 2023-12-21 00:00:00
period: 1d
basePeriod: 1h
exchanges: [{"eid":"Futures_Binance","currency":"BTC_USDT"}]
*/

//@version=5
strategy("SMA Crossover Strategy", overlay=true)

// Input parameters
fast_length = input(9, title="Fast SMA Length")
slow_length = input(45, title="Slow SMA Length")

// Calculate moving averages
fast_sma = ta.sma(close, fast_length)
slow_sma = ta.sma(close, slow_length)

// Buy condition
buy_condition = ta.crossover(close, fast_sma) and ta.crossover(close, slow_sma)

// Sell condition
sell_condition = ta.crossunder(close, fast_sma) and ta.crossunder(close, slow_sma)

// Calculate stop loss levels
prev_low = request.security(syminfo.tickerid, "1D", low[1], lookahead=barmerge.lookahead_on)
prev_high = request.security(syminfo.tickerid, "1D", high[1], lookahead=barmerge.lookahead_on)

// Plot signals on the chart
plotshape(buy_condition, style=shape.triangleup, location=location.belowbar, color=color.green, size=size.small)
plotshape(sell_condition, style=shape.triangledown, location=location.abovebar, color=color.red, size=size.small)

// Strategy exit conditions
long_stop_loss = sell_condition ? prev_low : na
short_stop_loss = buy_condition ? prev_high : na

strategy.exit("Long Exit", from_entry="Long", when=sell_condition, stop=long_stop_loss)
strategy.exit("Short Exit", from_entry="Short", when=buy_condition, stop=short_stop_loss)

strategy.entry("Long", strategy.long, when=buy_condition)
strategy.entry("Short", strategy.short, when=sell_condition)