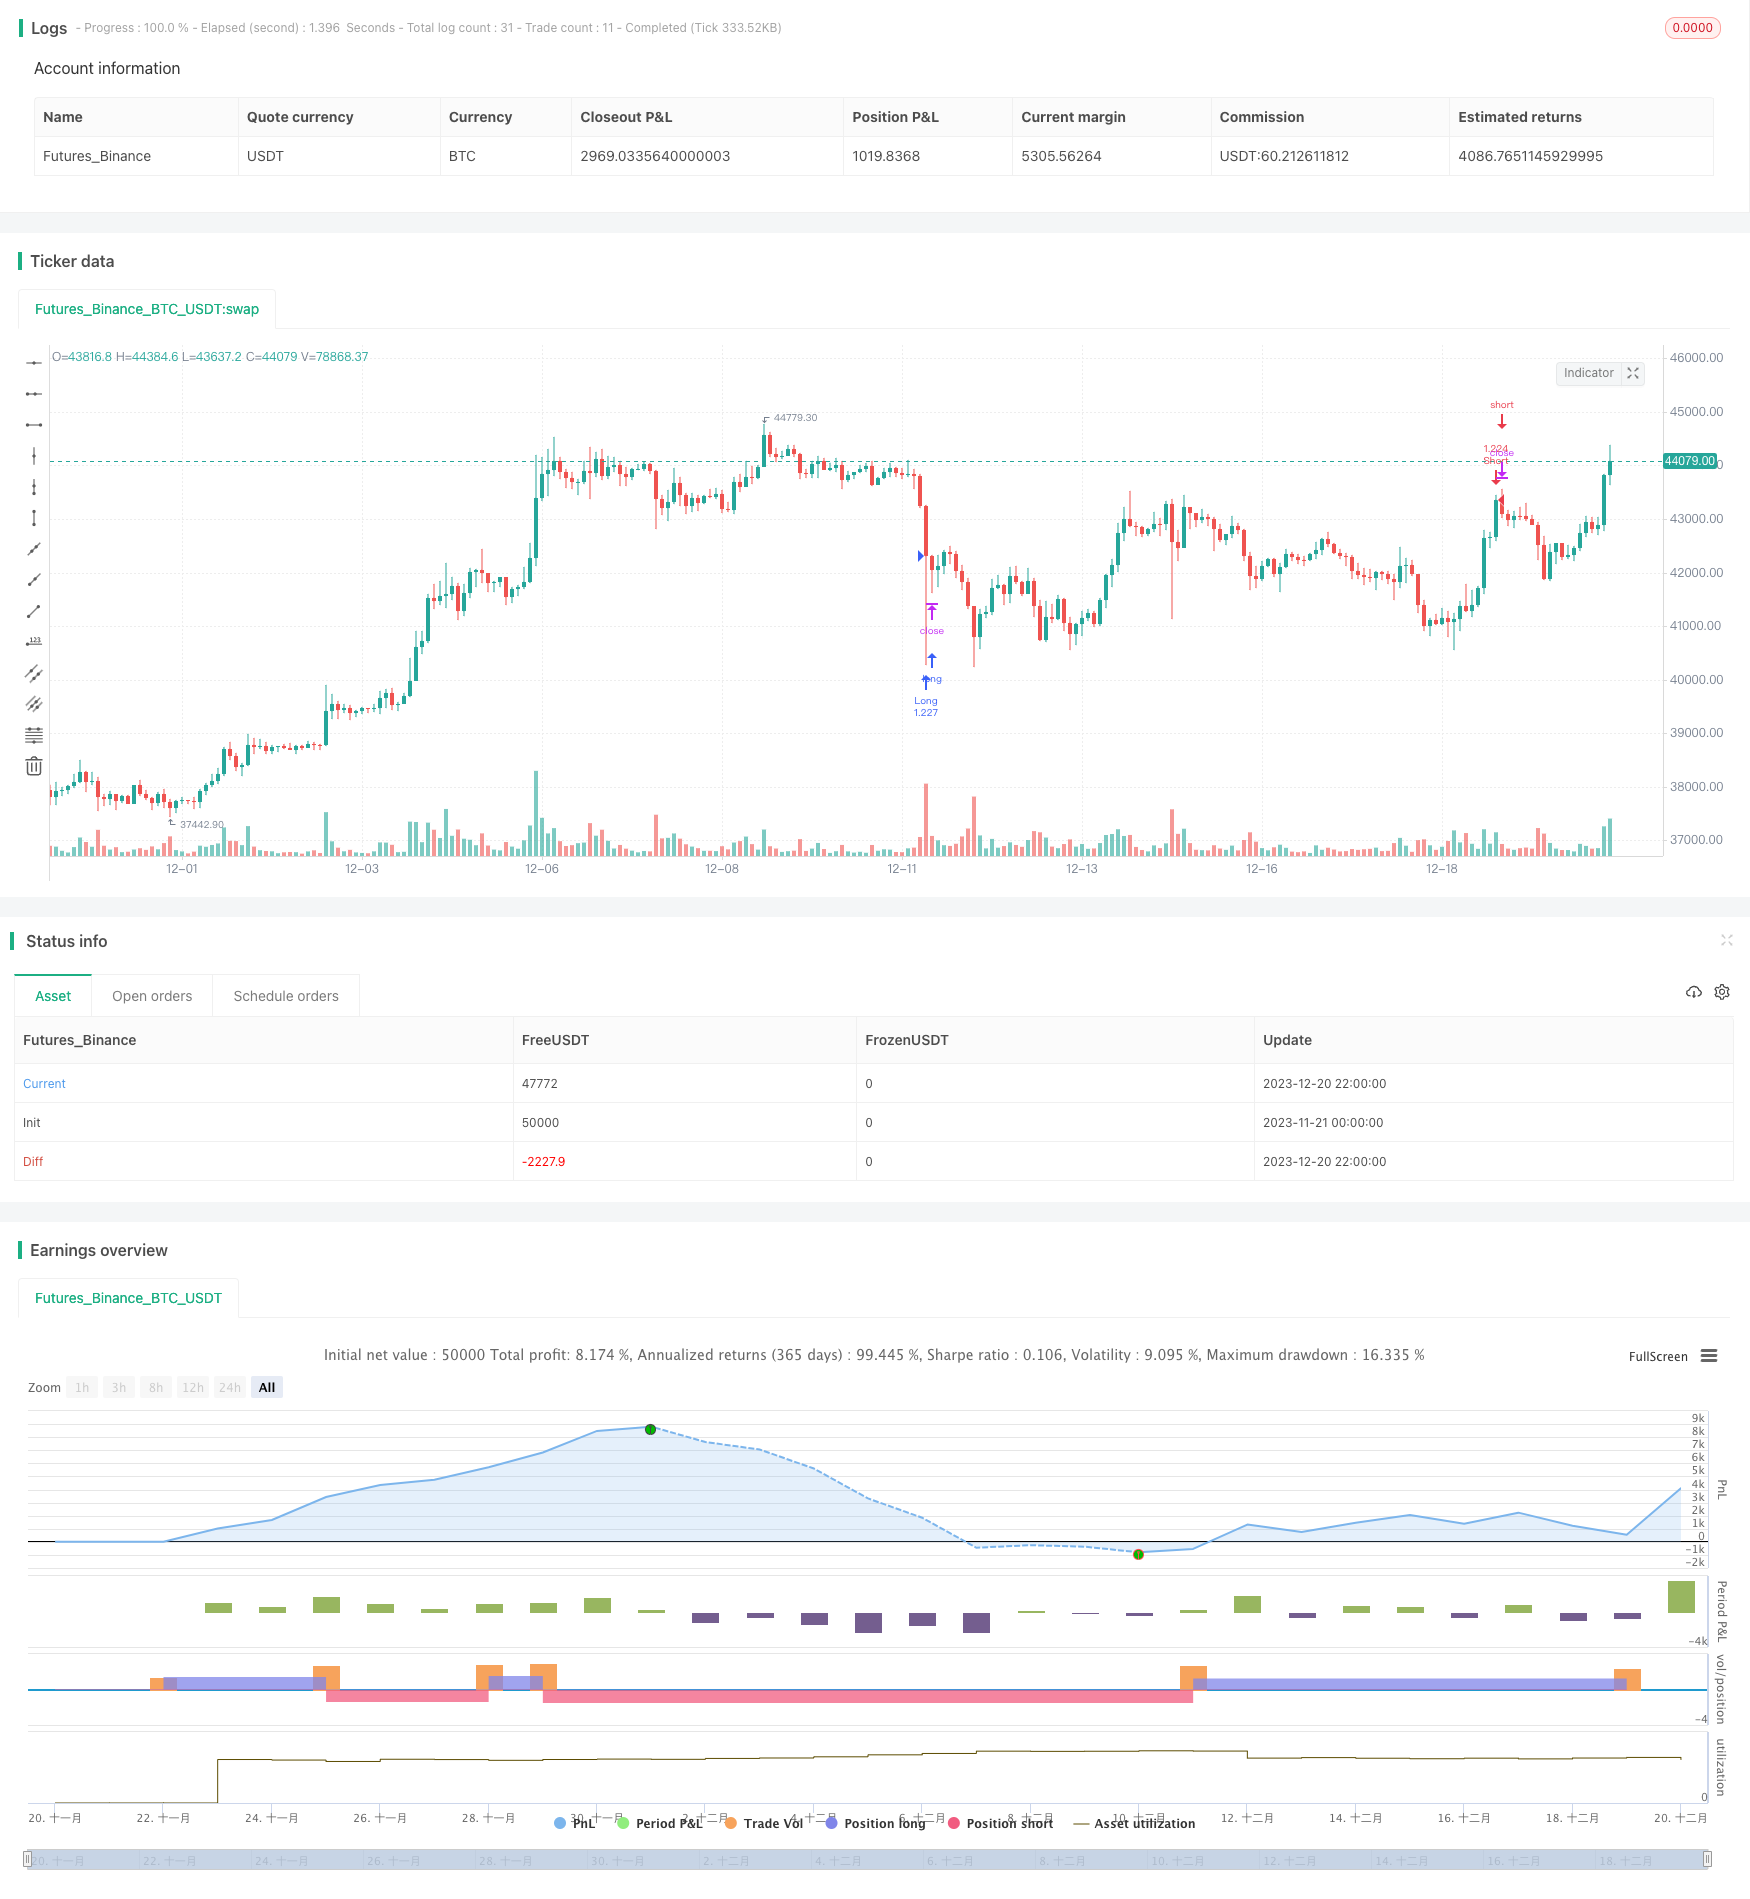
概述
RSI突破策略是一个基于相对强弱指数(RSI)指标的量化交易策略。该策略通过设定RSI过买区和过卖区的阈值,在RSI指标突破这些阈值时产生交易信号,即当RSI低于30时做多,当RSI高于70时做空。
策略原理
RSI突破策略的核心思想是利用RSI指标判断市场的超买超卖现象。RSI通过计算一段时期内股票的平均涨幅和平均跌幅之比,反映出股票最近的强弱态势。一般来说,RSI低于30视为超卖现象,高于70视为超买现象。
该策略首先设置RSI的过卖线和超买线,默认为30和70。然后实时监测RSI线的运行情况。当RSI从上向下突破70这一阈值时产生卖出信号。此时判断市场已经进入超买区域,预期很可能触顶回落,因此采取卖出头寸的操作。相反,当RSI从下向上突破30这一阈值时产生买入信号。此时判断市场已经超卖,预期很可能触底反弹,因此采取买入头寸的操作。
通过这种方式,策略试图在股票波动过程中捕捉其价格转折点,在超买超卖现象发生时及时调整头寸,做到“买低卖高”。
策略优势
RSI突破策略具有如下优势:
操作信号简单明了。RSI指标容易计算和理解,仅需观察其指标线突破设定的阈值上下限。当发生指标突破时即可操作,没有复杂的交易规则。
完全量化,回测效果较好。该策略从RSI指标中提取交易信号,无需人工干预和判断,可轻松实现自动化交易。同时RSI的超买超卖信号效果较好,策略回测也展现出可观的收益。
可定制性强。交易者可以灵活调整RSI参数,如调整超买超卖的阈值,以适应不同股票和行情的特征。
策略风险
RSI突破策略也存在一定的风险,主要包括:
容易形成whipsaw。当指标震荡上下时,会频繁触发突破交易信号。此时策略会产生过多无效交易,不利于获得稳定收益。可适当调整参数,过滤掉部分震荡信号。
不能判断市场趋势。RSI仅从超买超卖状态产生交易信号,对大趋势判断能力较弱。策略容易在震荡行情中被套牢。可配合趋势指标进行过滤,避免逆势交易。
回撤风险较大。RSI经常会表现出多头背离的行为,即价格继续上涨而RSI指标向下。此时策略作空运行与大趋势背离,将面临巨大亏损。
策略优化
RSI突破策略可从以下维度进行优化:
综合考量多种指标,避免单一RSI指标的局限性。例如结合移动平均线指标判断市场趋势,或使用强弱指标、成交量指标进行组合过滤交易信号。
优化RSI参数以提高策略稳定性。包含调整超买超卖阈值、设置交易信号持续时间等。通过测试获得最佳参数,过滤掉大量无效信号。
设定止损止盈条件以控制风险,例如设定百分比或点数止损。避免单次亏损过大对总体收益影响。同时结合趋势及重要技术位置进行 parts profit。
总结
RSI突破策略是一个利用超买超卖现象进行反转交易的量化策略。策略信号简单明确,完全量化,可定制性强。但也存在一定whipsaw风险及回撤风险。通过指标组合优化及风险控制等方式,可以将RSI突破策略调优为稳定可靠的量化系统。
/*backtest
start: 2023-11-21 00:00:00
end: 2023-12-21 00:00:00
period: 2h
basePeriod: 15m
exchanges: [{"eid":"Futures_Binance","currency":"BTC_USDT"}]
*/

// @version=4
// This source code is subject to the terms of the Mozilla Public License 2.0 at https://mozilla.org/MPL/2.0/
// © Bunghole 2021

strategy(title="My New Strategy", initial_capital = 100000, default_qty_type = strategy.percent_of_equity, default_qty_value = 100, pyramiding = 0, currency = 'USD', overlay=true)

//// Stoploss and Take Profit Parameters
// Enable Long Strategy
enable_long_strategy = input(true, title="Enable Long Strategy", group="SL/TP For Long Strategy",inline="1")
long_stoploss_value = input(defval=50, title='Stoploss %', type=input.float, minval=0.1, group="SL/TP For Long Strategy",inline="2")
long_stoploss_percentage = (close * (long_stoploss_value / 100)) / syminfo.mintick
long_takeprofit_value = input(defval=50, title='Take Profit %', type=input.float, minval=0.1, group="SL/TP For Long Strategy",inline="2")
long_takeprofit_percentage = (close * (long_takeprofit_value / 100)) / syminfo.mintick

// Enable Short Strategy
enable_short_strategy = input(true, title="Enable Short Strategy", group="SL/TP For Short Strategy",inline="3")
short_stoploss_value = input(defval=50, title='Stoploss %', type=input.float, minval=0.1, group= "SL/TP For Short Strategy",inline="4")
short_stoploss_percentage = (close * (short_stoploss_value / 100)) / syminfo.mintick
short_takeprofit_value = input(defval=50, title='Take Profit %', type=input.float, minval=0.1, group="SL/TP For Short Strategy",inline="4")
short_takeprofit_percentage = (close * (short_takeprofit_value / 100)) / syminfo.mintick

// Plot Stoploss & Take Profit Levels
long_stoploss_price = strategy.position_avg_price * (1 - long_stoploss_value/100)
long_takeprofit_price = strategy.position_avg_price * (1 + long_takeprofit_value/100)
short_stoploss_price = strategy.position_avg_price * (1 + short_stoploss_value/100)
short_takeprofit_price = strategy.position_avg_price * (1 - short_takeprofit_value/100)
plot(enable_long_strategy and not enable_short_strategy ? long_stoploss_price: na, color=#ff0000, style=plot.style_linebr, linewidth=2, title="Long SL Level")
plot(enable_long_strategy and not enable_short_strategy ? long_takeprofit_price: na, color=#008000, style=plot.style_linebr, linewidth=2, title="Long TP Level")
plot(enable_short_strategy and not enable_long_strategy ? short_stoploss_price: na, color=#ff0000, style=plot.style_linebr, linewidth=2, title="Short SL Level")
plot(enable_short_strategy and not enable_long_strategy ? short_takeprofit_price: na, color=#008000, style=plot.style_linebr, linewidth=2, title="Short TP Level")

// Date Range
start_date = input(title="Start Date", type=input.integer, defval=1, minval=1, maxval=31, group="Date Range")
start_month = input(title="Start Month", type=input.integer, defval=1, minval=1, maxval=12, group="Date Range")
start_year = input(title="Start Year", type=input.integer, defval=1804, minval=1800, maxval=3000, group="Date Range")
end_date = input(title="End Date", type=input.integer, defval=1, minval=1, maxval=3, group="Date Range")
end_month = input(title="End Month", type=input.integer, defval=1, minval=1, maxval=12, group="Date Range")
end_year = input(title="End Year", type=input.integer, defval=2077, minval=1800, maxval=3000, group="Date Range")
in_date_range = (time >= timestamp(syminfo.timezone, start_year, start_month, start_date, 0, 0)) and (time < timestamp(syminfo.timezone, end_year, end_month, end_date, 0, 0))

//// Inputs   **This is where you enter your indicators for your strategy. For example, I added the RSI indicator.**
//RSI
rsi = rsi(close, 14)
rsi_over_sold = rsi < 30
rsi_over_bought = rsi > 70


//// Strategy  **This is where you create your strategy. For example, We have or buy and sell signals.**
// Creating Long and Short Strategy
buy_signal = rsi_over_sold
sell_signal = rsi_over_bought

// Long Strategy
if buy_signal and in_date_range and enable_long_strategy == true
    strategy.entry("Long", true, when=buy_signal, alert_message="Open Long Position")
    strategy.exit("Long  SL/TP", from_entry="Long", loss=long_stoploss_percentage, profit=long_takeprofit_percentage, alert_message="Your Long SL/TP Limit As Been Triggered.")
    strategy.close("Long", when=sell_signal, alert_message="Close Long Position")

// Short Strategy
if sell_signal and in_date_range and enable_short_strategy == true
    strategy.entry("Short", false, when = sell_signal, alert_message="Open Short Position")
    strategy.exit("Short SL/TP", from_entry="Short", loss=short_stoploss_percentage, profit=short_takeprofit_percentage, alert_message="Your Short SL/TP Limit As Been Triggered.")
    strategy.close("Short", when=buy_signal, alert_message="Close Short Position")