YinYang RSI Volume Trend Trading Strategy

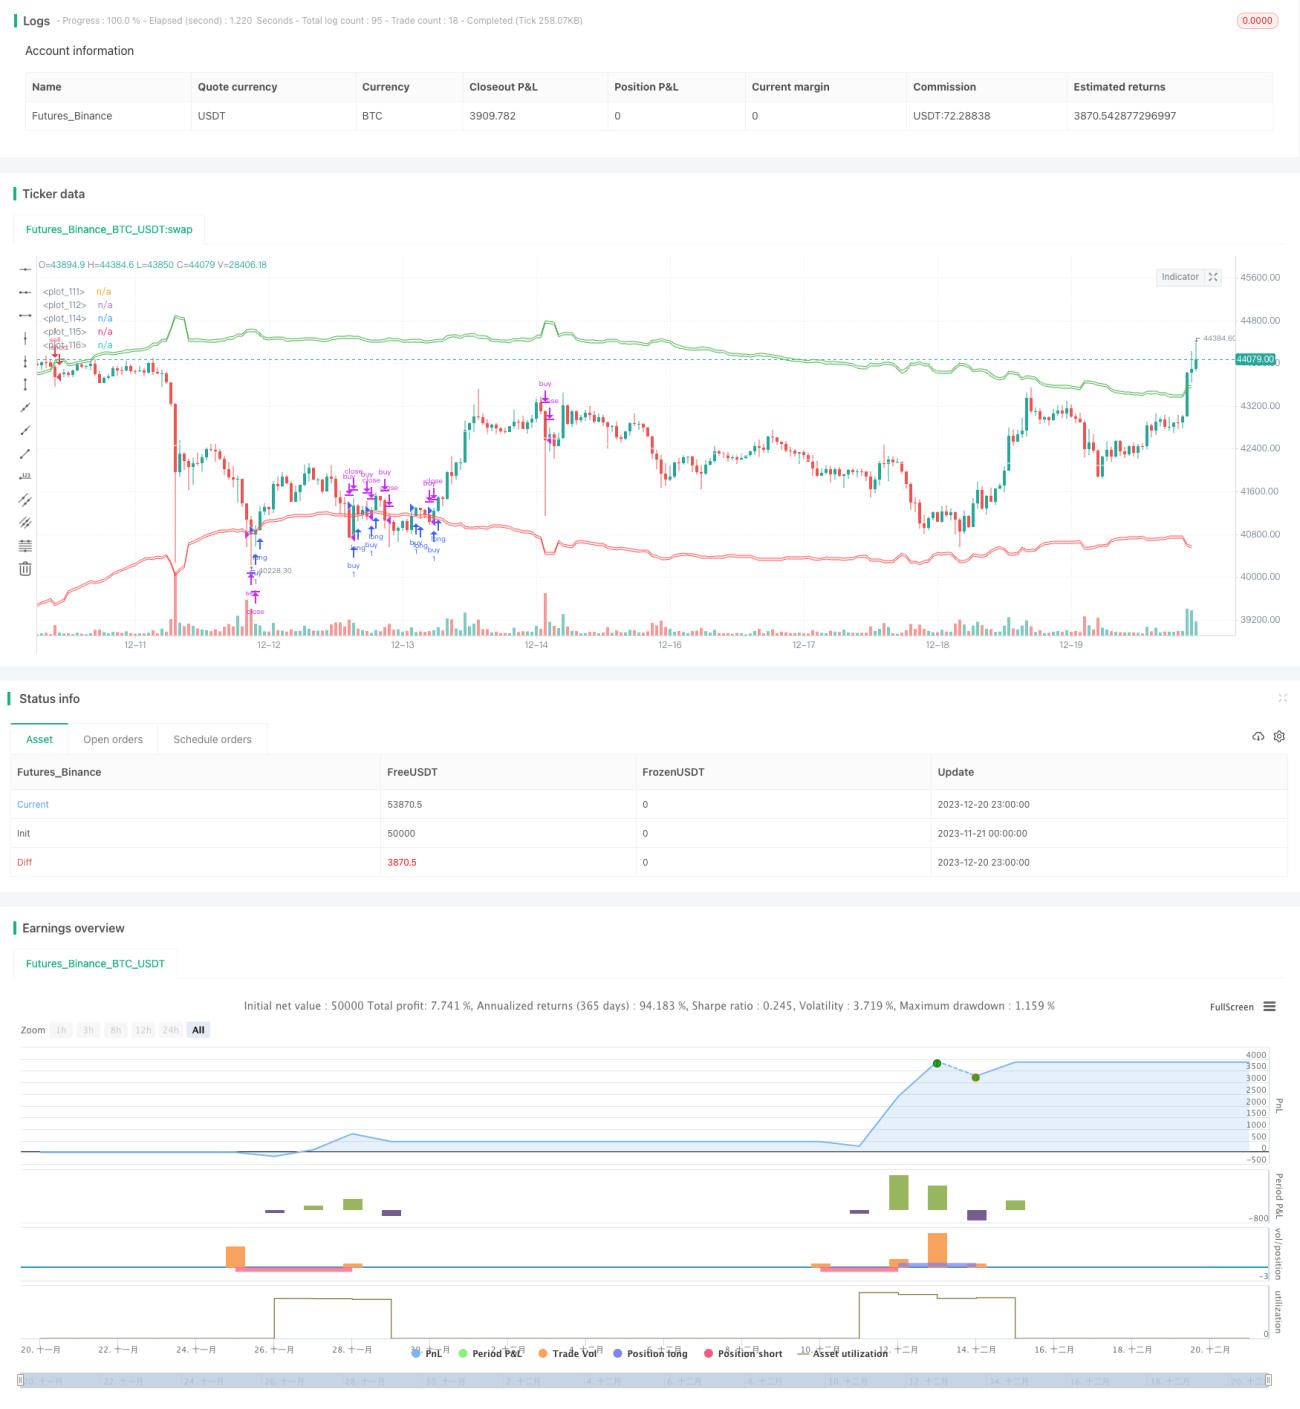
Overview
This strategy is a trend following strategy that utilizes a combination of Relative Strength Index (RSI) and volume to identify trend direction and follow trends. Key points include:
- Using Volume Weighted Moving Average to calculate midline and incorporate volume information to determine trend midpoint
- Setting up buy zone and sell zone based on midline
- Using RSI information to adjust range of buy zone and sell zone
- Setting stop loss and take profit after entering buy/sell zones
- Having re-entry mechanism
Strategy Logic
This strategy uses the following indicators and parameters:
- Midline: Volume Weighted Moving Average of highest and lowest prices in certain periods to determine midpoint of the trend
- RSI: Relative Strength Index calculated over certain periods, converted into 0-1 range
- Buy Zone: Midline plus RSI adjusted amount at certain ratio, long entry when price enters
- Sell Zone: Midline minus RSI adjusted amount at certain ratio, short entry when price enters
- Take Profit Line: Midline
- Stop Loss Line: Certain percentage below buy zone/above sell zone
When price enters buy or sell zone, a corresponding direction order will be opened. Stop loss and take profit lines are then set. When take profit or stop loss is triggered, position will be closed. A re-entry mechanism is also set so that new orders can be opened when signal triggers again if configured.
Advantages
The advantages of this strategy include:
- Using both RSI and volume to identify trends, improving accuracy
- RSI parameterized adjustment makes buy/sell zone adapt better to actual trend
- Volume information assigns higher weight to price actions, making midline more accurate
- Having stop loss mechanism to control risks
- Allows re-entry, reducing risks of false breakouts
Risks
There are also some risks:
- Improper RSI and volume parameters may affect buy/sell zone accuracy
- Midline may fail to accurately determine trend, causing false breakout
- Stop loss too wide may lead to higher losses
- Re-entry may cause over-trading
Solutions:
- Adjust RSI and volume cycle to fit market conditions
- Use other indicators to verify buy/sell signals
- Tighten stop loss to limit losses
- Limit trades per day to prevent over-trading
Optimization
This strategy can be optimized by:
- Trying other indicators to verify signals e.g. candlestick, volatility indicators etc
- Adding position sizing mechanisms e.g. pyramiding winners
- Using machine learning algorithms to improve buy/sell zone accuracy
- Evaluating optimum parameters for stop loss and take profit
- Parameters need separate test and optimization for different products
Conclusion
In conclusion, this is a quantitative trend following strategy utilizing RSI and volume indicators. It has dual verification system to identify signals, stop loss/profit take to control risks, and re-entry mechanism to improve profitability. With parameter tuning and algorithm optimization, it can become a very practical trend trading strategy.
/*backtest
start: 2023-11-21 00:00:00
end: 2023-12-21 00:00:00
period: 1h
basePeriod: 15m
exchanges: [{"eid":"Futures_Binance","currency":"BTC_USDT"}]
*/

// This source code is subject to the terms of the Mozilla Public License 2.0 at https://mozilla.org/MPL/2.0/
// @@@@@@@@@@@@@@@@@@@@@@@@@@@@@@@@@@@@@@@@@@@@@@@@@@@@@@@@@@@@@@@@@@@@@@@@@@@@@@@@
// @@@@@@@@@@@@@@@@@@@@@@@@@@@@@@@@@@@@@@@@@@@@@@@@ @@@@@@@@@@@@@@@@@@@@@@@@@@@@@@@
// @@@@@@@@@@@@@@@@@@@@@@@@@@@@@@@@@@@@@@@@@@@@@@@@@@@@ ,@@@@@@@@@@@@@@@@@@@@@@@- 1