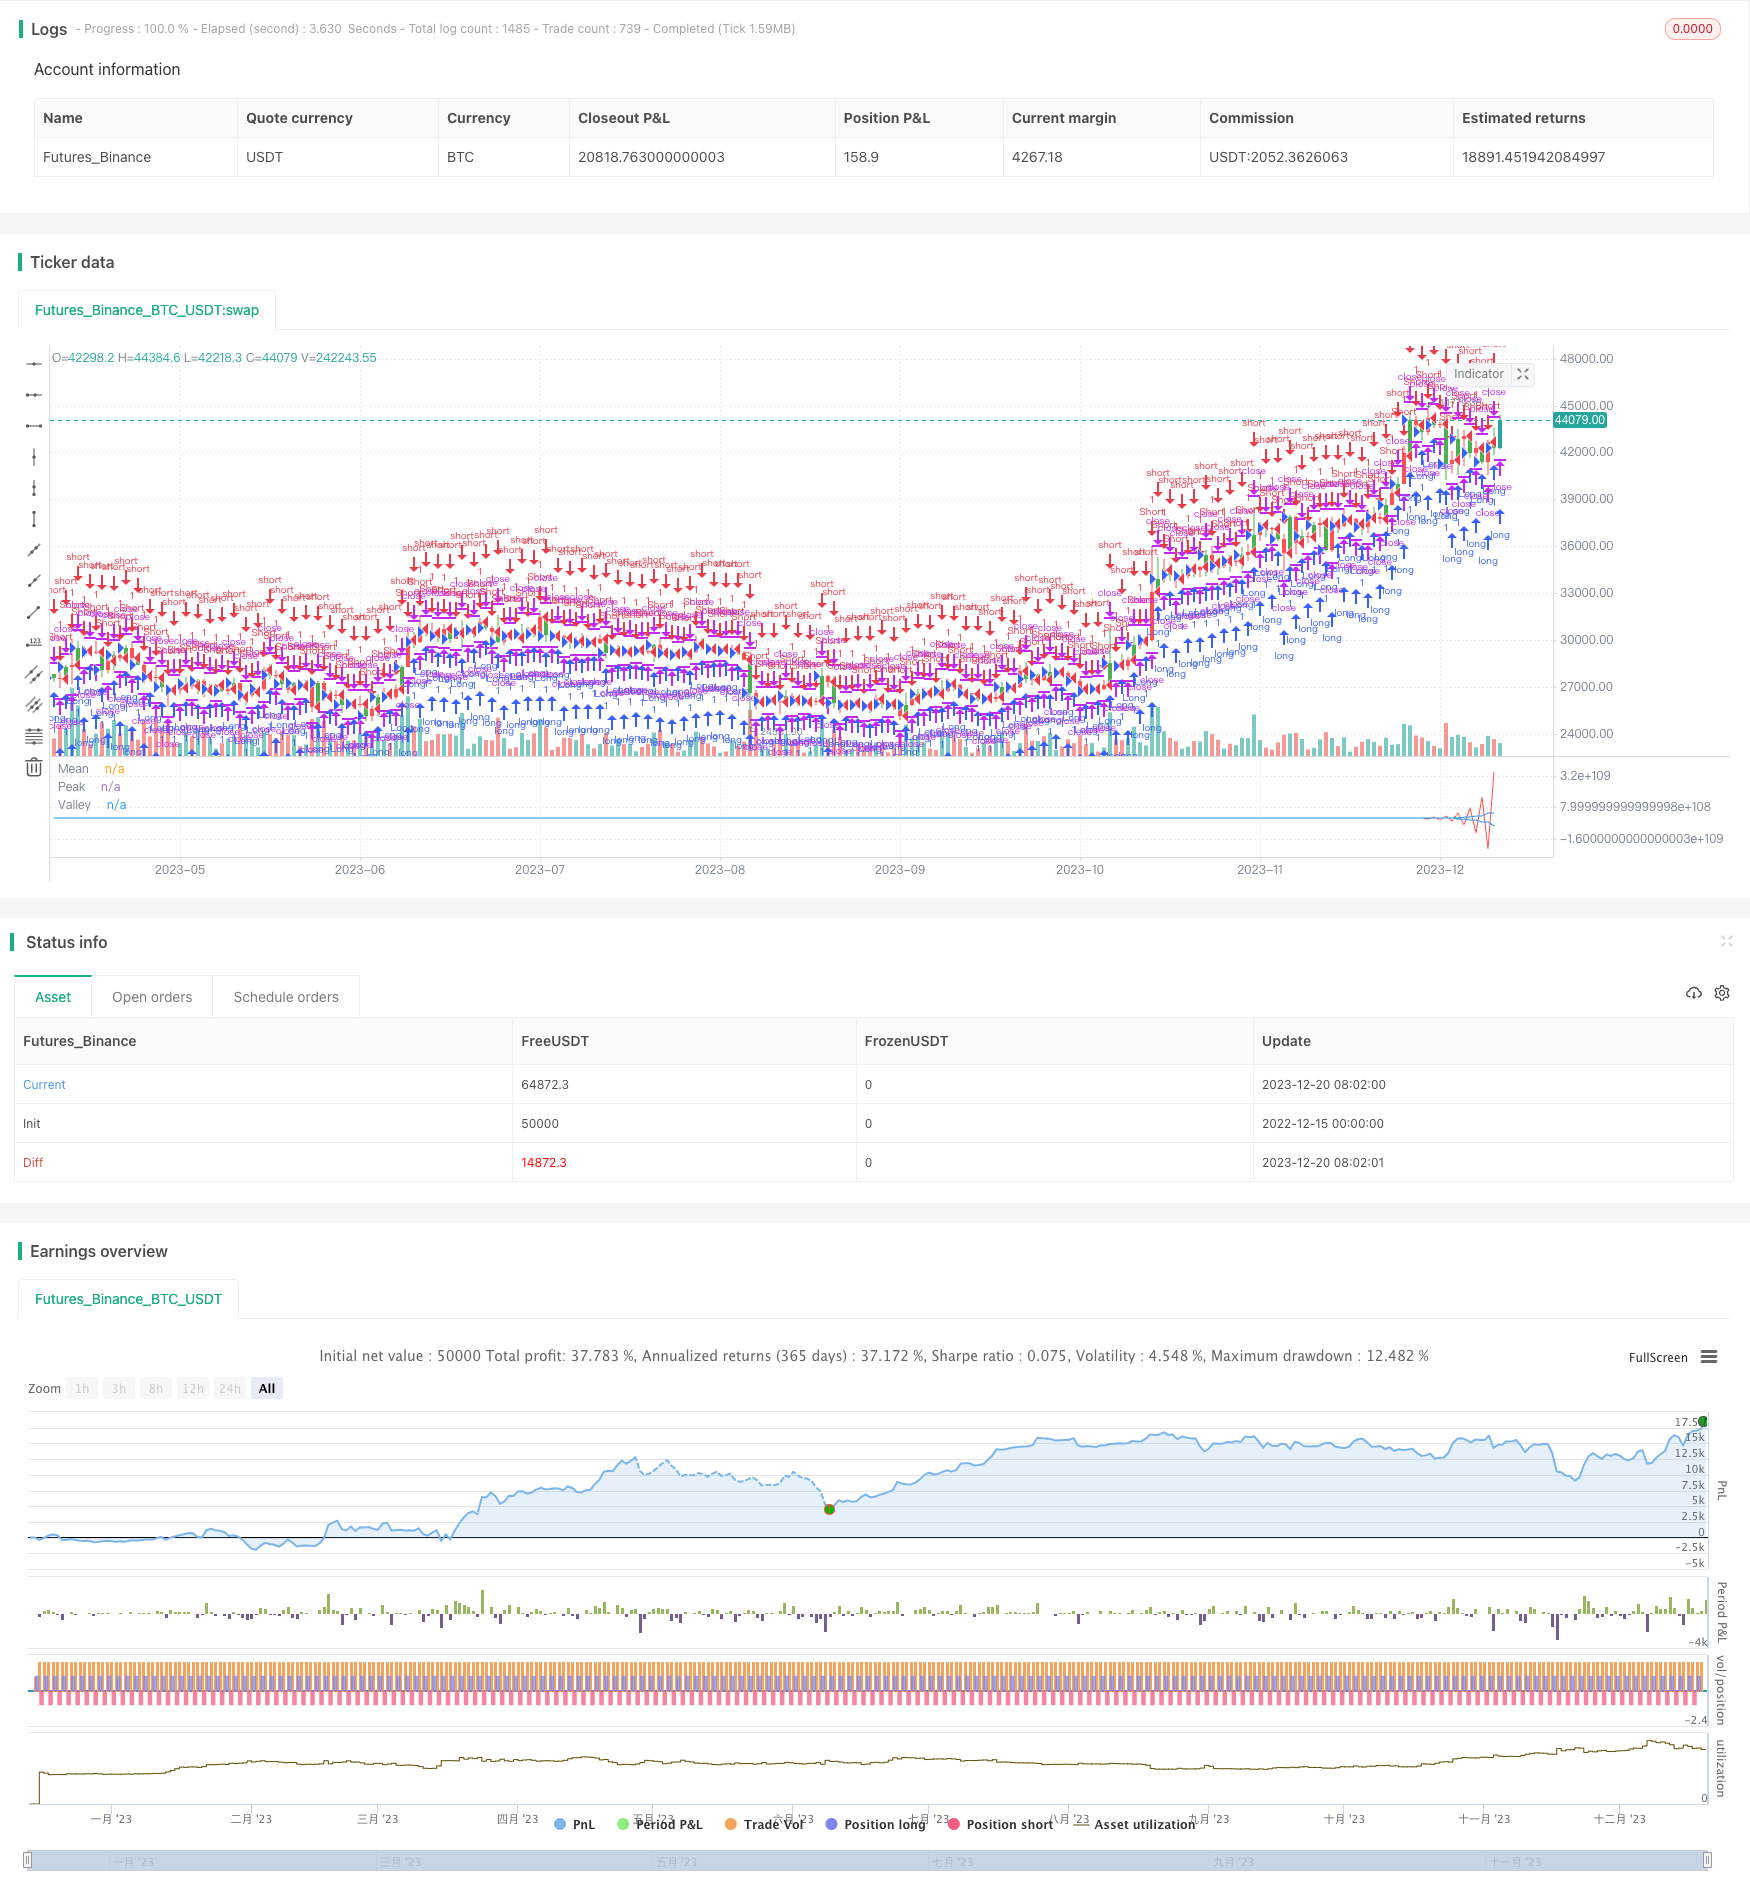
概述
本策略基于经验模态分解(Empirical Mode Decomposition,EMD)方法,对价格序列进行分解,提取不同波段的特征,并结合均值进行交易信号生成。该策略主要适用于中长线持仓。
策略原理
- 使用EMD方法对价格做带通滤波,提取价格中的波动特征
- 计算得到峰值序列和谷值序列的移动平均
- 当均值线超过一定比例的峰值线和谷值线时生成交易信号
- 根据交易信号做多头或空头
优势分析
- 使用EMD方法能有效分解价格序列,提取有用特征
- 峰谷线控制了策略只在价格波动大于一定幅度时才交易
- 结合均值线,可以有效滤除假突破
风险分析
- EMD方法参数选择不当可能导致过拟合
- 需要较长周期才能形成交易信号,无法适应高频交易
- 无法应对价格剧烈波动的市场环境
优化方向
- 优化EMD模型的参数,提高对市场的适应性
- 结合其他指标作为止损止盈信号
- 尝试不同的价格序列作为策略输入
总结
本策略利用经验模态分解方法对价格序列进行特征提取,并基于提取的特征生成交易信号,实现了一个稳定的中长线交易策略。该策略优势在于能够有效识别价格中的周期性特征,并在大幅波动中发出交易指令。但也存在一定风险,需要进一步优化以适应更加复杂的市场环境。
策略源码
/*backtest
start: 2022-12-15 00:00:00
end: 2023-12-21 00:00:00
period: 1d
basePeriod: 1h
exchanges: [{"eid":"Futures_Binance","currency":"BTC_USDT"}]
*/

//@version=2
////////////////////////////////////////////////////////////
//  Copyright by HPotter v1.0 12/04/2017
// The related article is copyrighted material from Stocks & Commodities Mar 2010
// You can use in the xPrice any series: Open, High, Low, Close, HL2, HLC3, OHLC4 and ect...
//
// You can change long to short in the Input Settings
// Please, use it only for learning or paper trading. Do not for real trading.
////////////////////////////////////////////////////////////
strategy(title="Empirical Mode Decomposition")
Length = input(20, minval=1)
Delta = input(0.5)
Fraction = input(0.1)
reverse = input(false, title="Trade reverse")
xPrice = hl2
beta = cos(3.1415 * (360 / Length) / 180)
gamma = 1 / cos(3.1415 * (720 * Delta / Length) / 180)
alpha = gamma - sqrt(gamma * gamma - 1)
xBandpassFilter = 0.5 * (1 - alpha) * (xPrice - xPrice[2]) + beta * (1 + alpha) * nz(xBandpassFilter[1]) - alpha * nz(xBandpassFilter[2])
xMean = sma(xBandpassFilter, 2 * Length)
xPeak =  iff (xBandpassFilter[1] > xBandpassFilter and xBandpassFilter[1] > xBandpassFilter[2], xBandpassFilter[1], nz(xPeak[1]))
xValley =  iff (xBandpassFilter[1] < xBandpassFilter and xBandpassFilter[1] < xBandpassFilter[2], xBandpassFilter[1], nz(xValley[1]))
xAvrPeak = sma(xPeak, 50)
xAvrValley = sma(xValley, 50)
nAvrPeak = Fraction * xAvrPeak
nAvrValley = Fraction * xAvrValley
pos = iff(xMean > nAvrPeak and xMean > nAvrValley, 1,
	     iff(xMean < nAvrPeak and xMean < nAvrValley, -1, nz(pos[1], 0)))
possig = iff(reverse and pos == 1, -1,
          iff(reverse and pos == -1, 1, pos))
if (possig == 1)
    strategy.entry("Long", strategy.long)
if (possig == -1)
    strategy.entry("Short", strategy.short)
barcolor(possig == -1 ? red: possig == 1 ? green : blue )
plot(xMean, color=red, title="Mean")
plot(nAvrPeak, color=blue, title="Peak")
plot(nAvrValley, color=blue, title="Valley")