Parabolic SAR Momentum Reversal Strategy

Overview
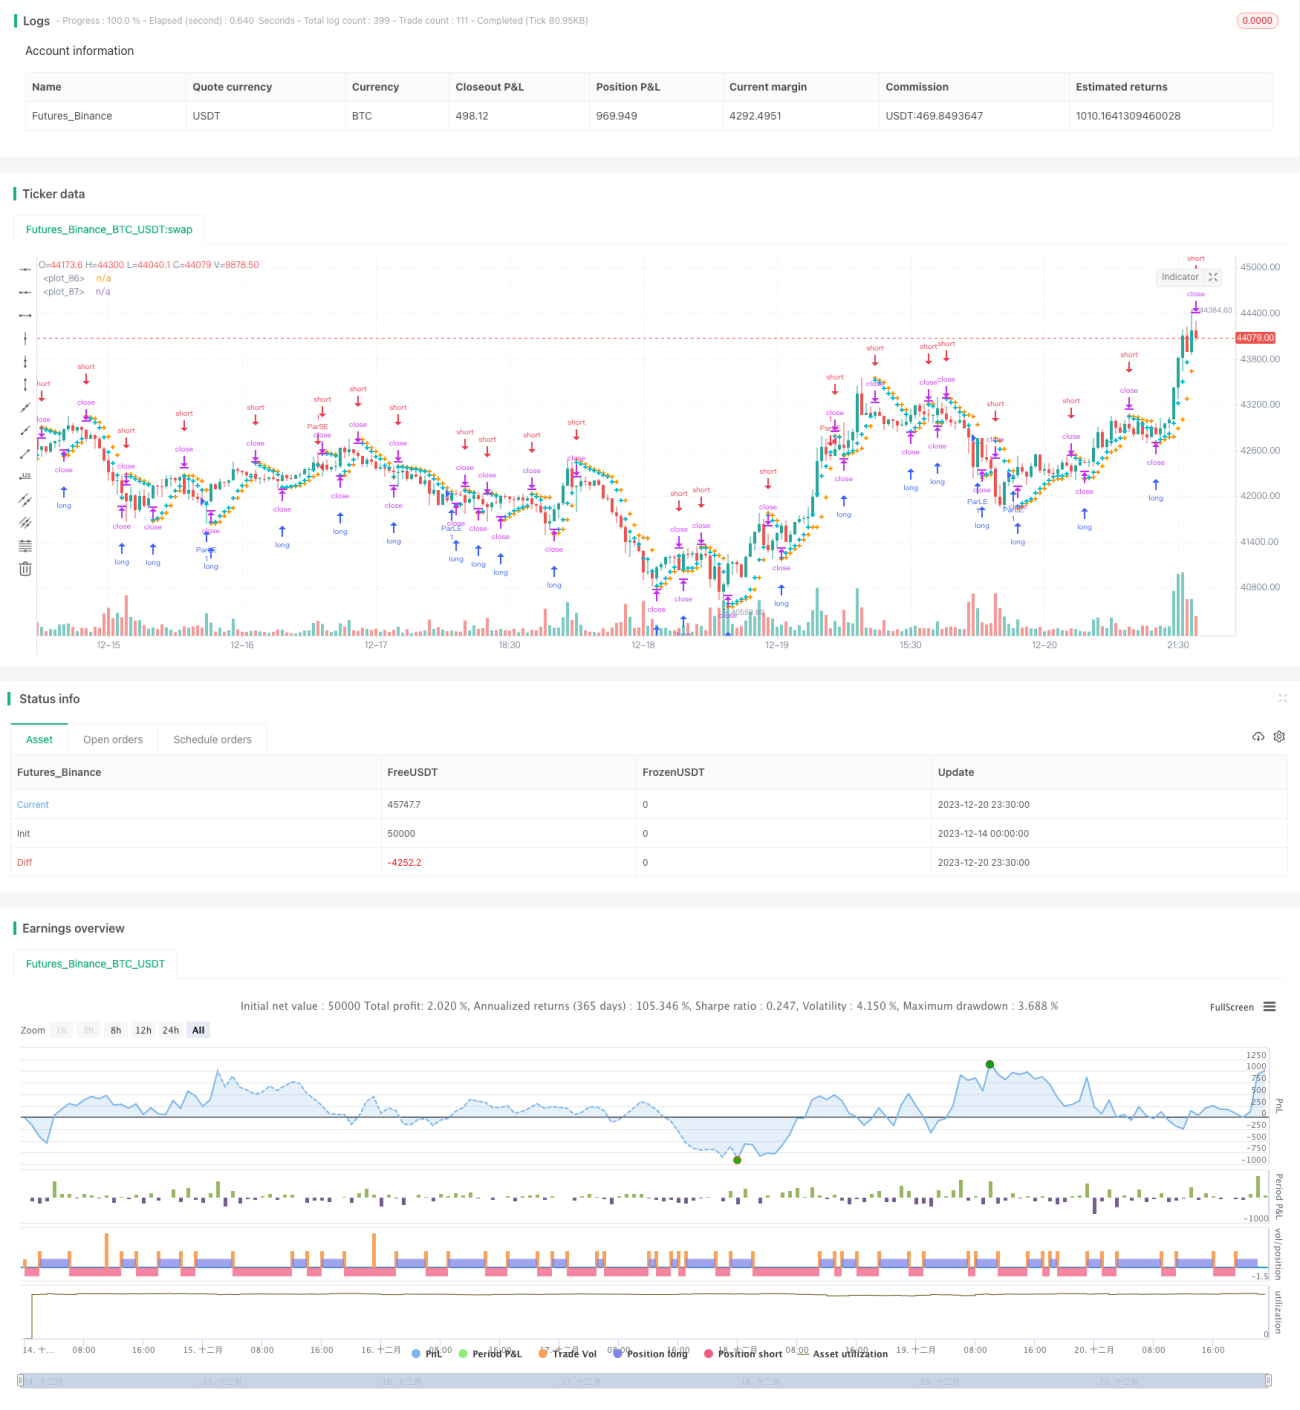
This strategy utilizes the crossover operation between the Parabolic SAR sliding value and candlestick to achieve momentum tracking and stop loss for swing trading. The strategy will establish long and short positions when the price is rising and falling. It will close out these positions to stop loss when the price reverses.
Strategy Logic
The core of this strategy relies on the Parabolic SAR indicator to determine whether the current price is in an upward or downward trend. When the Parabolic SAR indicator is below the candlestick, it means that the price is currently rising. In this case, the strategy will check at the close of each candlestick whether the Parabolic SAR value crosses above the low of the candlestick. If not, it means the upward trend continues and the strategy will establish a long position. If Parabolic SAR crosses above the low, it means the upside trend reverses downside, and the strategy will close the long position to stop loss.
On the contrary, when Parabolic SAR is above the candlestick, it means the price is currently falling. In this case, the strategy will check at the close of each candlestick whether Parabolic SAR crosses below the high of the candlestick. If not, it will establish a short position. If Parabolic SAR crosses the high, it means the downside trend reverses upside, and the strategy will close the short position to stop loss.
Through this logic, the strategy can establish positions along the price trend and realize stop loss in the first time when trend reverses, locking in profits. Meanwhile, Parabolic SAR as a momentum indicator can more accurately determine whether the trend is reversed, making the stop loss more precise.
Advantages
- Parabolic SAR is an advanced and accurate technical indicator to determine trend and reversal points, improving judgment accuracy.
- Taking advantage of momentum tracking and reversal stop loss methods can make full use of trending opportunities.
- The strict stop loss rules mean good risk control capability.
- Optimized parameters make this strategy particularly suitable for GBP/JPY with strong trend.
Risks
- Like any single indicator strategies, this strategy may suffer from Parabolic SAR's misjudgement on trend and reversals. Invalid signals may lead to unnecessary losses.
- The strategy fully depends on Parabolic SAR for entries and exits. Improper parameter settings and loose stop loss points may fail to control risks effectively.
- Any single strategy may gradually deteriorate due to changing market structure and environments. Regular backtests and optimizations are necessary.
Methods to enhance robustness include: optimizing stop loss points to make them strict enough; combining other indicators for confirmation; adjusting parameters to adapt to changing environments; selecting optimal parameter sets for different products, etc.
Optimization Directions
- Test and optimize combinations of Parabolic SAR parameters for better performance.
- Combine other indicators like MACD, KD to form a multi-indicator confirmation system, improving signal reliability.
- Test effects of different stop loss methods like trail stop loss, time stop loss, price stop loss, etc.
- Optimize parameters based on different product characteristics so that the strategy can achieve good returns across products.
Conclusion
In general, this Parabolic SAR swing strategy is quite an effective short-term trading strategy. It takes advantage of Parabolic SAR to determine trend direction and momentum changes, together with swing trading methods, to repeatedly establish long and short positions during uptrends and downtrends. The strict stop loss mechanism also gives this strategy decent risk control capability. But as a single indicator strategy, the invalidity of Parabolic SAR will have a significant impact. So this is a strategy with some strength and potential, but also has some risks. It needs backtests, optimizations and enhancements to generate stable excess returns in live trading.
- 1