Dual Moving Average Bollinger Band Trend Tracking Strategy

Overview
This strategy utilizes a combination of Bollinger Bands and moving averages for trend identification and entry. It leverages the trend recognition capability of Bollinger Bands and the filtering effect of moving averages to effectively identify market trend directions for entry in trending markets.
Strategy Logic
-
Calculate Bollinger Channel to determine market trend direction
- Use highest high and lowest low to calculate channel bands
- Channel middle band is average of high and low
- Determine trend direction based on price location within channel
-
Compute bullish candle body size for stop loss and reversal signals
- Bullish candle body is absolute value of close minus open
- Compute N-period average of candle bodies, compare to current body for stop loss and reversal
-
Enter trades in channel direction upon trend confirmation
- Long entries near lower band in uptrends
- Short entries near upper band in downtrends
-
Utilize moving averages for filtration to avoid false signals
- Compute N-period moving average of closing price
- Generate signals only on moving average breakthroughs
Advantages
-
Systematic trend identification combining bands and moving averages
Bands clearly identify price channels and trend direction. Moving averages filter noise. Combination enables robust trend detection immune to sporadic market shocks.
-
Effective risk control via candle body stop loss
Comparing current candle body to historical average detects trend reversal for stop loss and position reduction. Effectively controls strategy risk.
-
Clear quantitative entry and stop loss rules
Strict moving average and channel direction requirements for entry. Candle body size stop loss rule. Makes entire system entry and exits clear and systematic.
Risk Analysis
-
Potential losses in range-bound markets
Whip-sawing price oscillating around bands can cause repeated minor losses. Position sizing should be reduced to limit loss impact.
-
Premature stop loss in strong trends
Short-term retracements can trigger stops in strong uptrends/downtrends. Stop loss width should be relaxed to ride trends.
-
Erroneous signals from poor parameter tuning
Suboptimal moving average and bands parameters can cause spurious signals. Parameters should be optimized for signal reliability.
Enhancement Opportunities
-
Optimize moving average lookback period
Adjust period to reduce smoothing for quicker trend change detection.
-
Test alternative stop loss mechanisms
Evaluate trailing stops, ATR stops etc. to find optimal system.
-
Incorporate machine learning models
Train models on extensive historical data to augment trend and signal prediction.
Conclusion
This strategy balances trend identification and risk control using Bollinger Bands and moving averages. The systematic quantitative approach with clear entry/exit rules enables effective reward capture with controlled risk. Further improvements via parameter tuning and machine learning integration will enhance robustness.
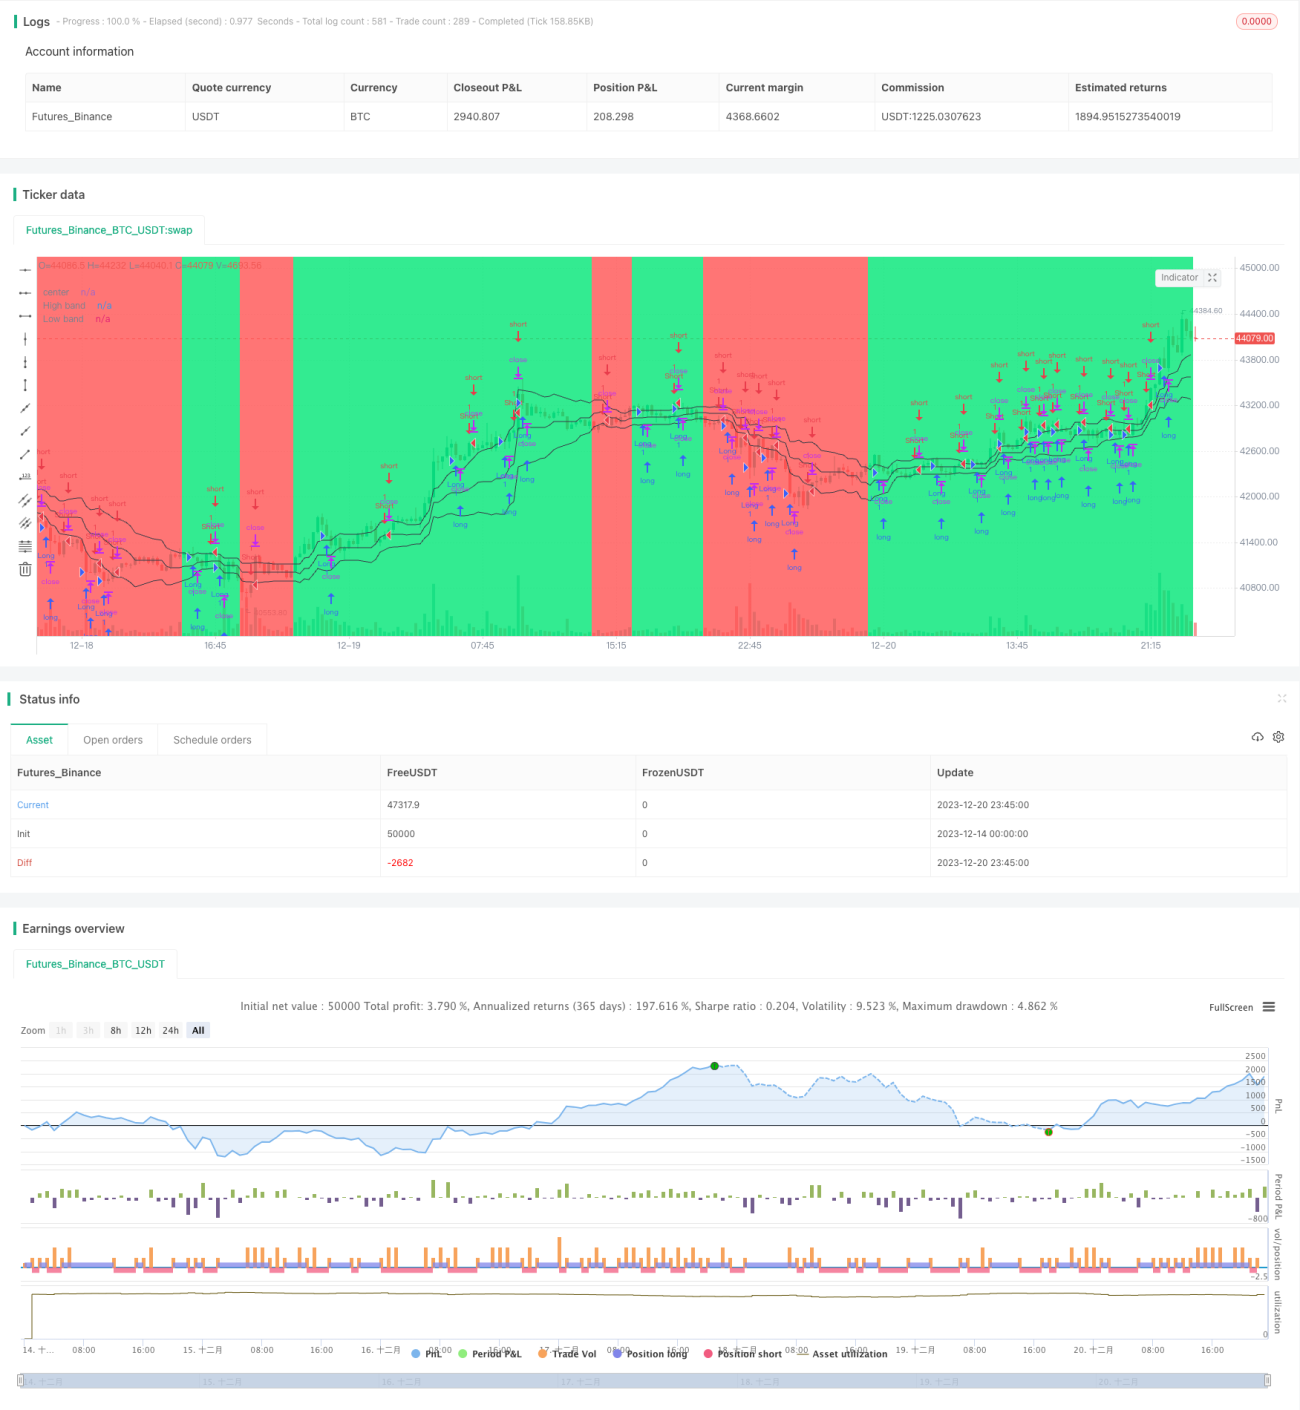
/*backtest
start: 2023-12-14 00:00:00
end: 2023-12-21 00:00:00
period: 15m
basePeriod: 5m
exchanges: [{"eid":"Futures_Binance","currency":"BTC_USDT"}]
*/


//@version=2
strategy("Noro's Bands Scalper Strategy v1.3", shorttitle = "Scalper str 1.3", overlay=true, default_qty_type = strategy.percent_of_equity, default_qty_value=100.0, pyramiding=0)
- 1