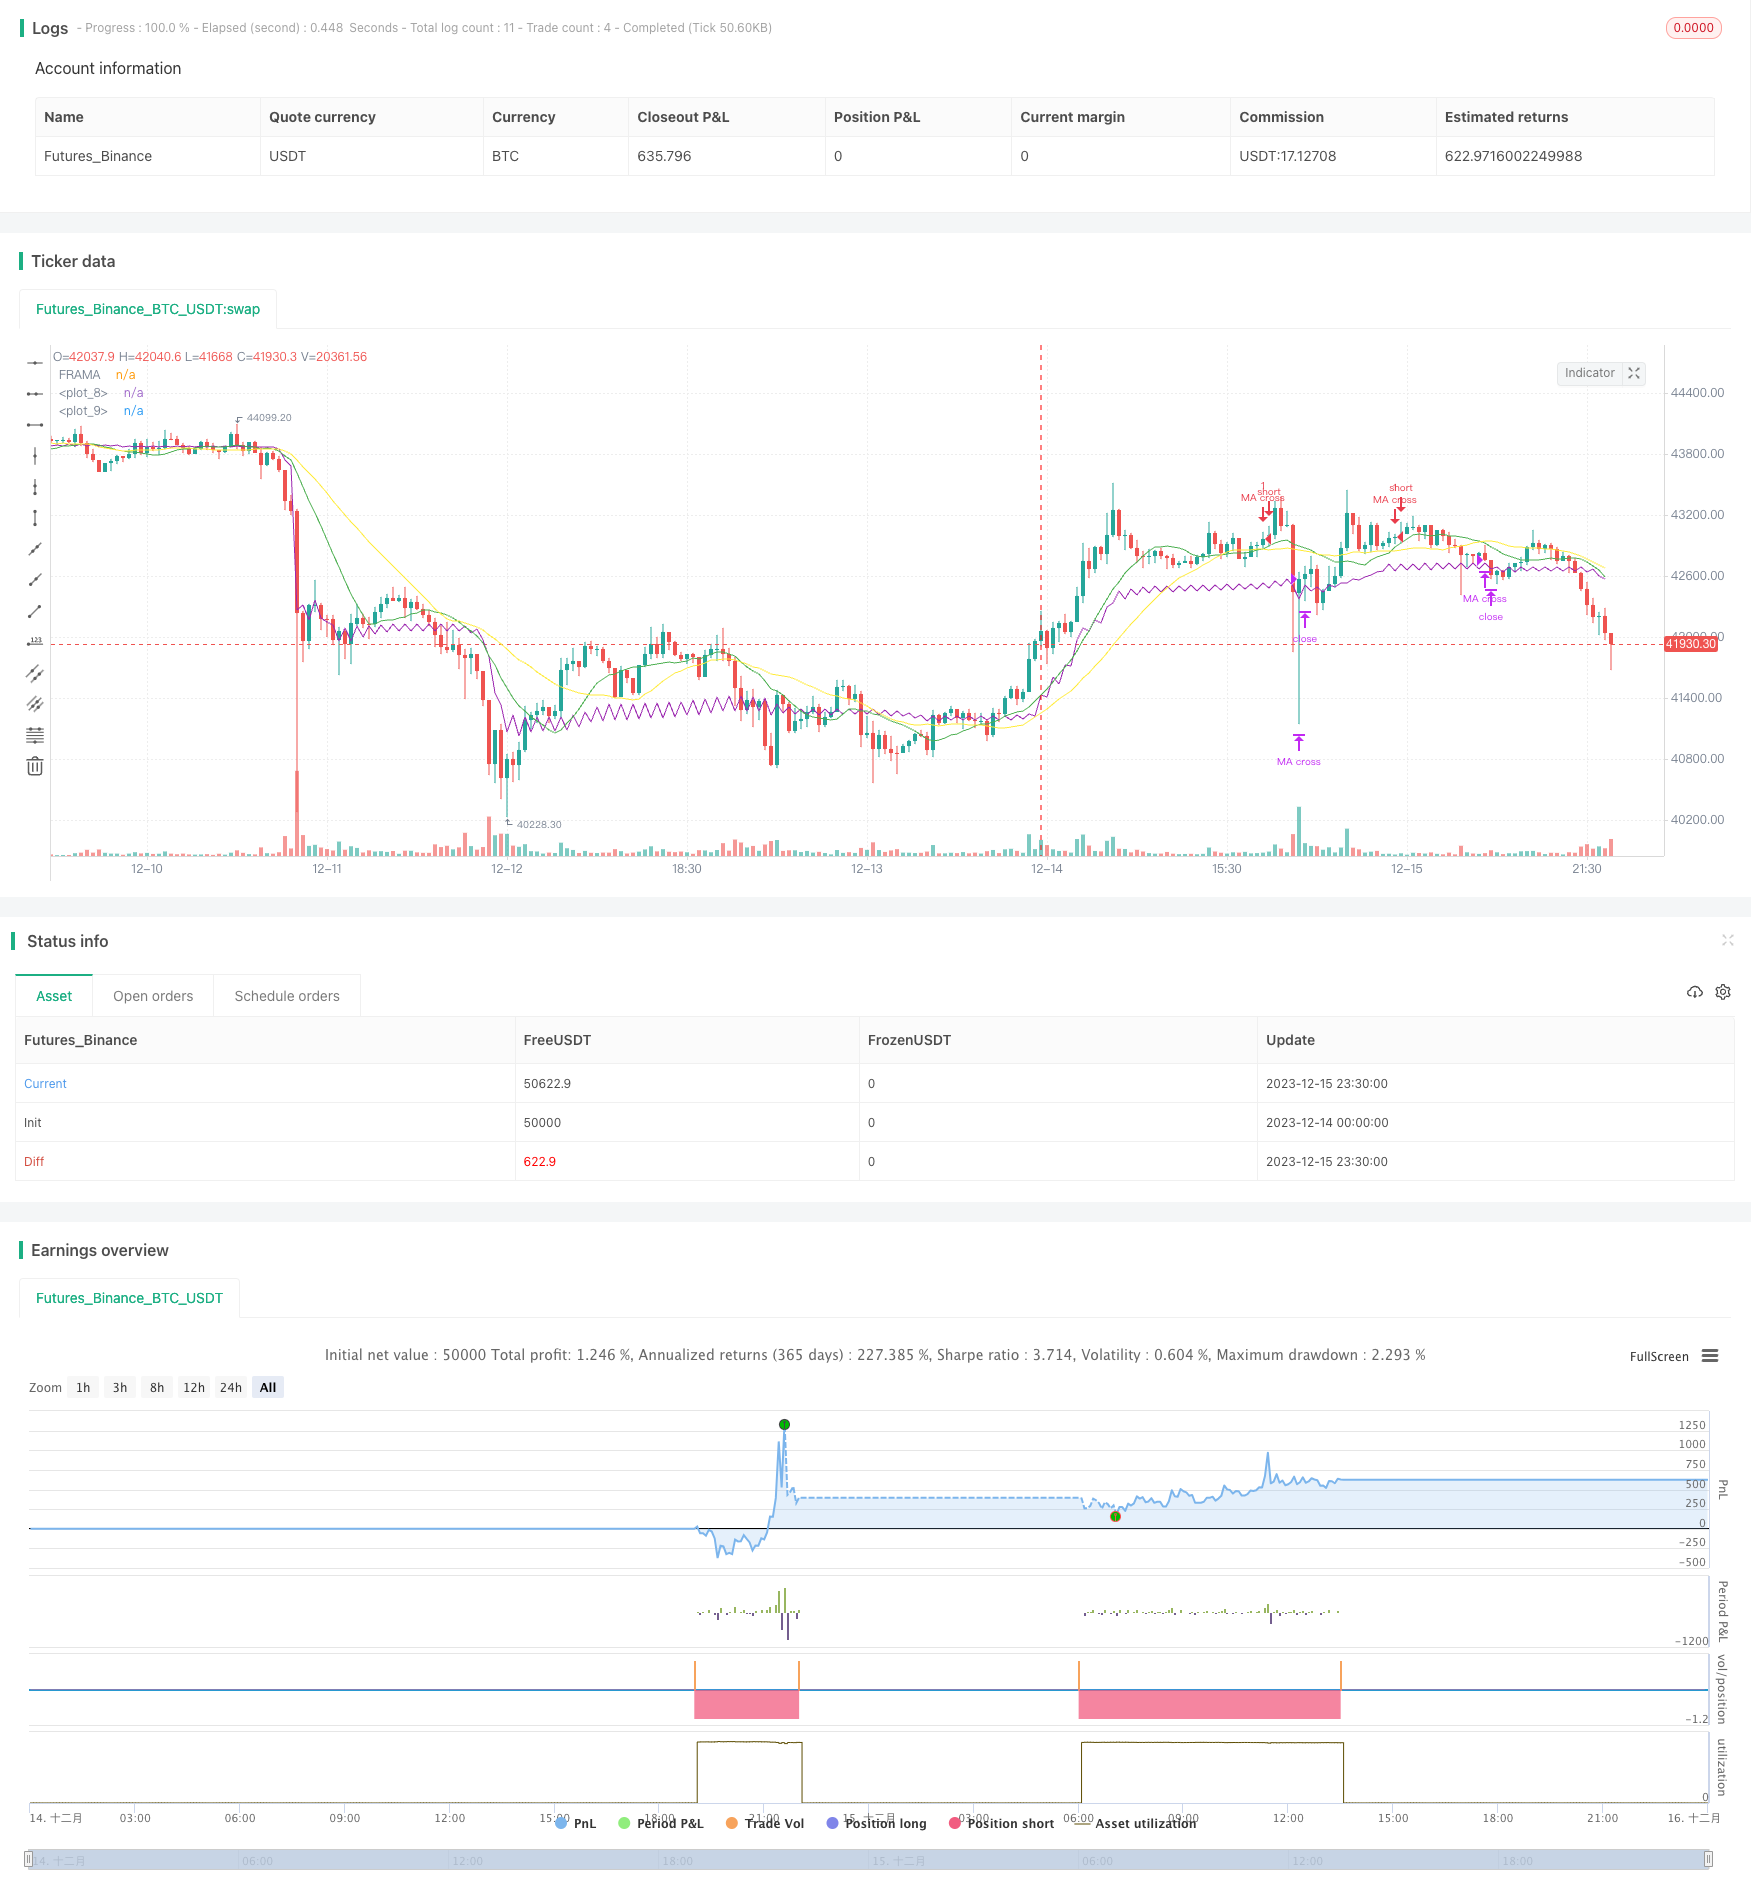
FRAMA and Moving Average Crossover Trading Strategy Based on Dual Moving Average

Author: ChaoZhang, Date: 2023-12-22 16:08:23
Tags:

img

Overview

This strategy first calculates the 13-period and 26-period simple moving averages, and then calculates the FRAMA indicator. It goes long when the fast line breaks through the slow line from bottom up, and exits the position when the fast line breaks through the slow line from top down or when the FRAMA indicator breaks through the closing price from top down.

Strategy Principle

The strategy mainly uses moving average crossover to generate trading signals. When the short-term moving average breaks through the long-term moving average from bottom up, it indicates the trend is turning from decline to rise, and goes long. When the short-term moving average crosses below the long-term one, it indicates an impending reversal, and closes the position.

Meanwhile, the FRAMA indicator is introduced as an auxiliary judgment. The FRAMA indicator is an adaptive moving average line improved based on the fractal market hypothesis. By calculating the logarithmic change rate of price fluctuation amplitude over different periods, it estimated the fractal dimension of the market in real time to dynamically adjust the smoothness of the moving average. When the FRAMA indicator crosses below the closing price, it indicates a trend reversal signal. Combined with the moving average crossover signal, it improves the accuracy of judgment.

Advantage Analysis

The strategy combines dual moving average crossover and FRAMA indicator, which can effectively filter false breakout signals and improve the quality of trading signals. The dual moving average crossover mainly judges the major trading direction, while the auxiliary FRAMA judgment can avoid missing reversal timing in oscillating markets.

Compared with single indicator and model, this strategy can significantly improve signal quality and reduce misjudgment probability. Meanwhile, combining fast and slow moving averages, it can follow the trend to avoid being trapped.

Risk Analysis

The main risks of this strategy lie in that the dual moving averages may produce more false breakout signals, and the parameter settings of the FRAMA indicator will also affect the effectiveness. In addition, there may be long periods without crossover between fast and slow lines, FRAMA and closing prices in certain market conditions, resulting in no trading opportunities.

To control the above risks, parameters like moving average periods can be adjusted accordingly, or filtered with other indicators. Besides, parameters of the FRAMA indicator including length, fractal factor also need to be set appropriately according to different markets, to avoid over-smoothing or over-sensitivity.

Optimization Directions

The strategy can be optimized in the following aspects:

  1. Test more combinations and periods of moving averages to find the optimal parameter pair.

  2. Add stop loss strategy to control single loss.

  3. Combine trading volume indicators to avoid false breakout under low volume.

  4. Add machine learning models to evaluate market status in real time and dynamically adjust parameters.

  5. Combine sentiment indicators, news and other multi-factors to improve decision quality.

Conclusion

This preliminary strategy combines the application of dual moving average crossover and FRAMA indicator. On the basis of keeping simplicity and intuition, it has effectively improved the signal quality and is worth further testing and optimization. With optimizations like parameter tuning, new indicator introduction, this strategy can be expected to become a stable and reliable trading strategy.


/*backtest
start: 2023-12-14 00:00:00
end: 2023-12-16 00:00:00
period: 30m
basePeriod: 15m
exchanges: [{"eid":"Futures_Binance","currency":"BTC_USDT"}]
*/

//@version=2
strategy("Fractal Adaptive Moving Average",shorttitle="FRAMA",overlay=true)


ma_fast = sma(close,13)

ma_slow = sma(close,26)
plot(ma_fast,color = green)
plot(ma_slow, color = yellow)
price = input(hl2)
len = input(defval=16,minval=1)
FC = input(defval=1,minval=1)
SC = input(defval=198,minval=1)
len1 = len/2
w = log(2/(SC+1))
H1 = highest(high,len1)
L1 = lowest(low,len1)
N1 = (H1-L1)/len1
H2 = highest(high,len)[len1]
L2 = lowest(low,len)[len1]
N2 = (H2-L2)/len1
H3 = highest(high,len)
L3 = lowest(low,len)
N3 = (H3-L3)/len
dimen1 = (log(N1+N2)-log(N3))/log(2)
dimen = iff(N1>0 and N2>0 and N3>0,dimen1,nz(dimen1[1]))
alpha1 = exp(w*(dimen-1))
oldalpha = alpha1>1?1:(alpha1<0.01?0.01:alpha1)
oldN = (2-oldalpha)/oldalpha
N = (((SC-FC)*(oldN-1))/(SC-1))+FC
alpha_ = 2/(N+1)
alpha = alpha_<2/(SC+1)?2/(SC+1):(alpha_>1?1:alpha_)
out = (1-alpha)*nz(out[1]) + alpha*price
plot(out,title="FRAMA",color=purple,transp=0)
entry() => crossover(ma_fast, ma_slow) and (out < close)
exit() => crossover(ma_slow, ma_fast) or crossunder(out, close)

strategy.entry(id= "MA cross", long = true, when = entry())
strategy.close(id= "MA cross", when = exit())

More