概述
BBMA突破策略是一种利用布林带和移动平均线的组合来产生交易信号的策略。该策略同时使用布林带上轨和下轨以及快速移动平均线和普通移动平均线之间的交叉作为入场信号。当价格突破布林带上轨线且快速移动平均线上穿普通移动平均线时做多,当价格跌破布林带下轨线且快速移动平均线下穿普通移动平均线时做空。
策略原理
该策略主要基于布林带理论和移动平均线理论。布林带被广泛应用于量化交易中,它由中轨、上轨和下轨线组成。中轨线是一定周期内的收盘价的简单移动平均线,上下轨线分别是中轨线上下一个标准差univ的距离。如果价格接近上轨表示市场可能超买,如果价格接近下轨表示市场可能超卖。
移动平均线也是常用的技术指标,主要用来判断潮向,判断主力资金的流入流出。快速移动平均线能更快捕捉价格变化趋势,普通移动平均线更加稳定。当快速移动平均线上穿普通移动平均线时为黄金交叉,代表市场可能步入上升行情。
该策略综合考虑了布林带理论和移动平均线理论,通过价格突破布林带上下轨并且快慢均线发生特定交叉的组合信号判断市场买卖点,作为入场信号指引交易方向。
策略优势
使用布林带理论判断市场买卖点,有利于抓住价格反转机会。
综合考量快速移动平均线和普通移动平均线的交叉信号,避免假突破。
建立止损和止盈点有利于严格控制风险。
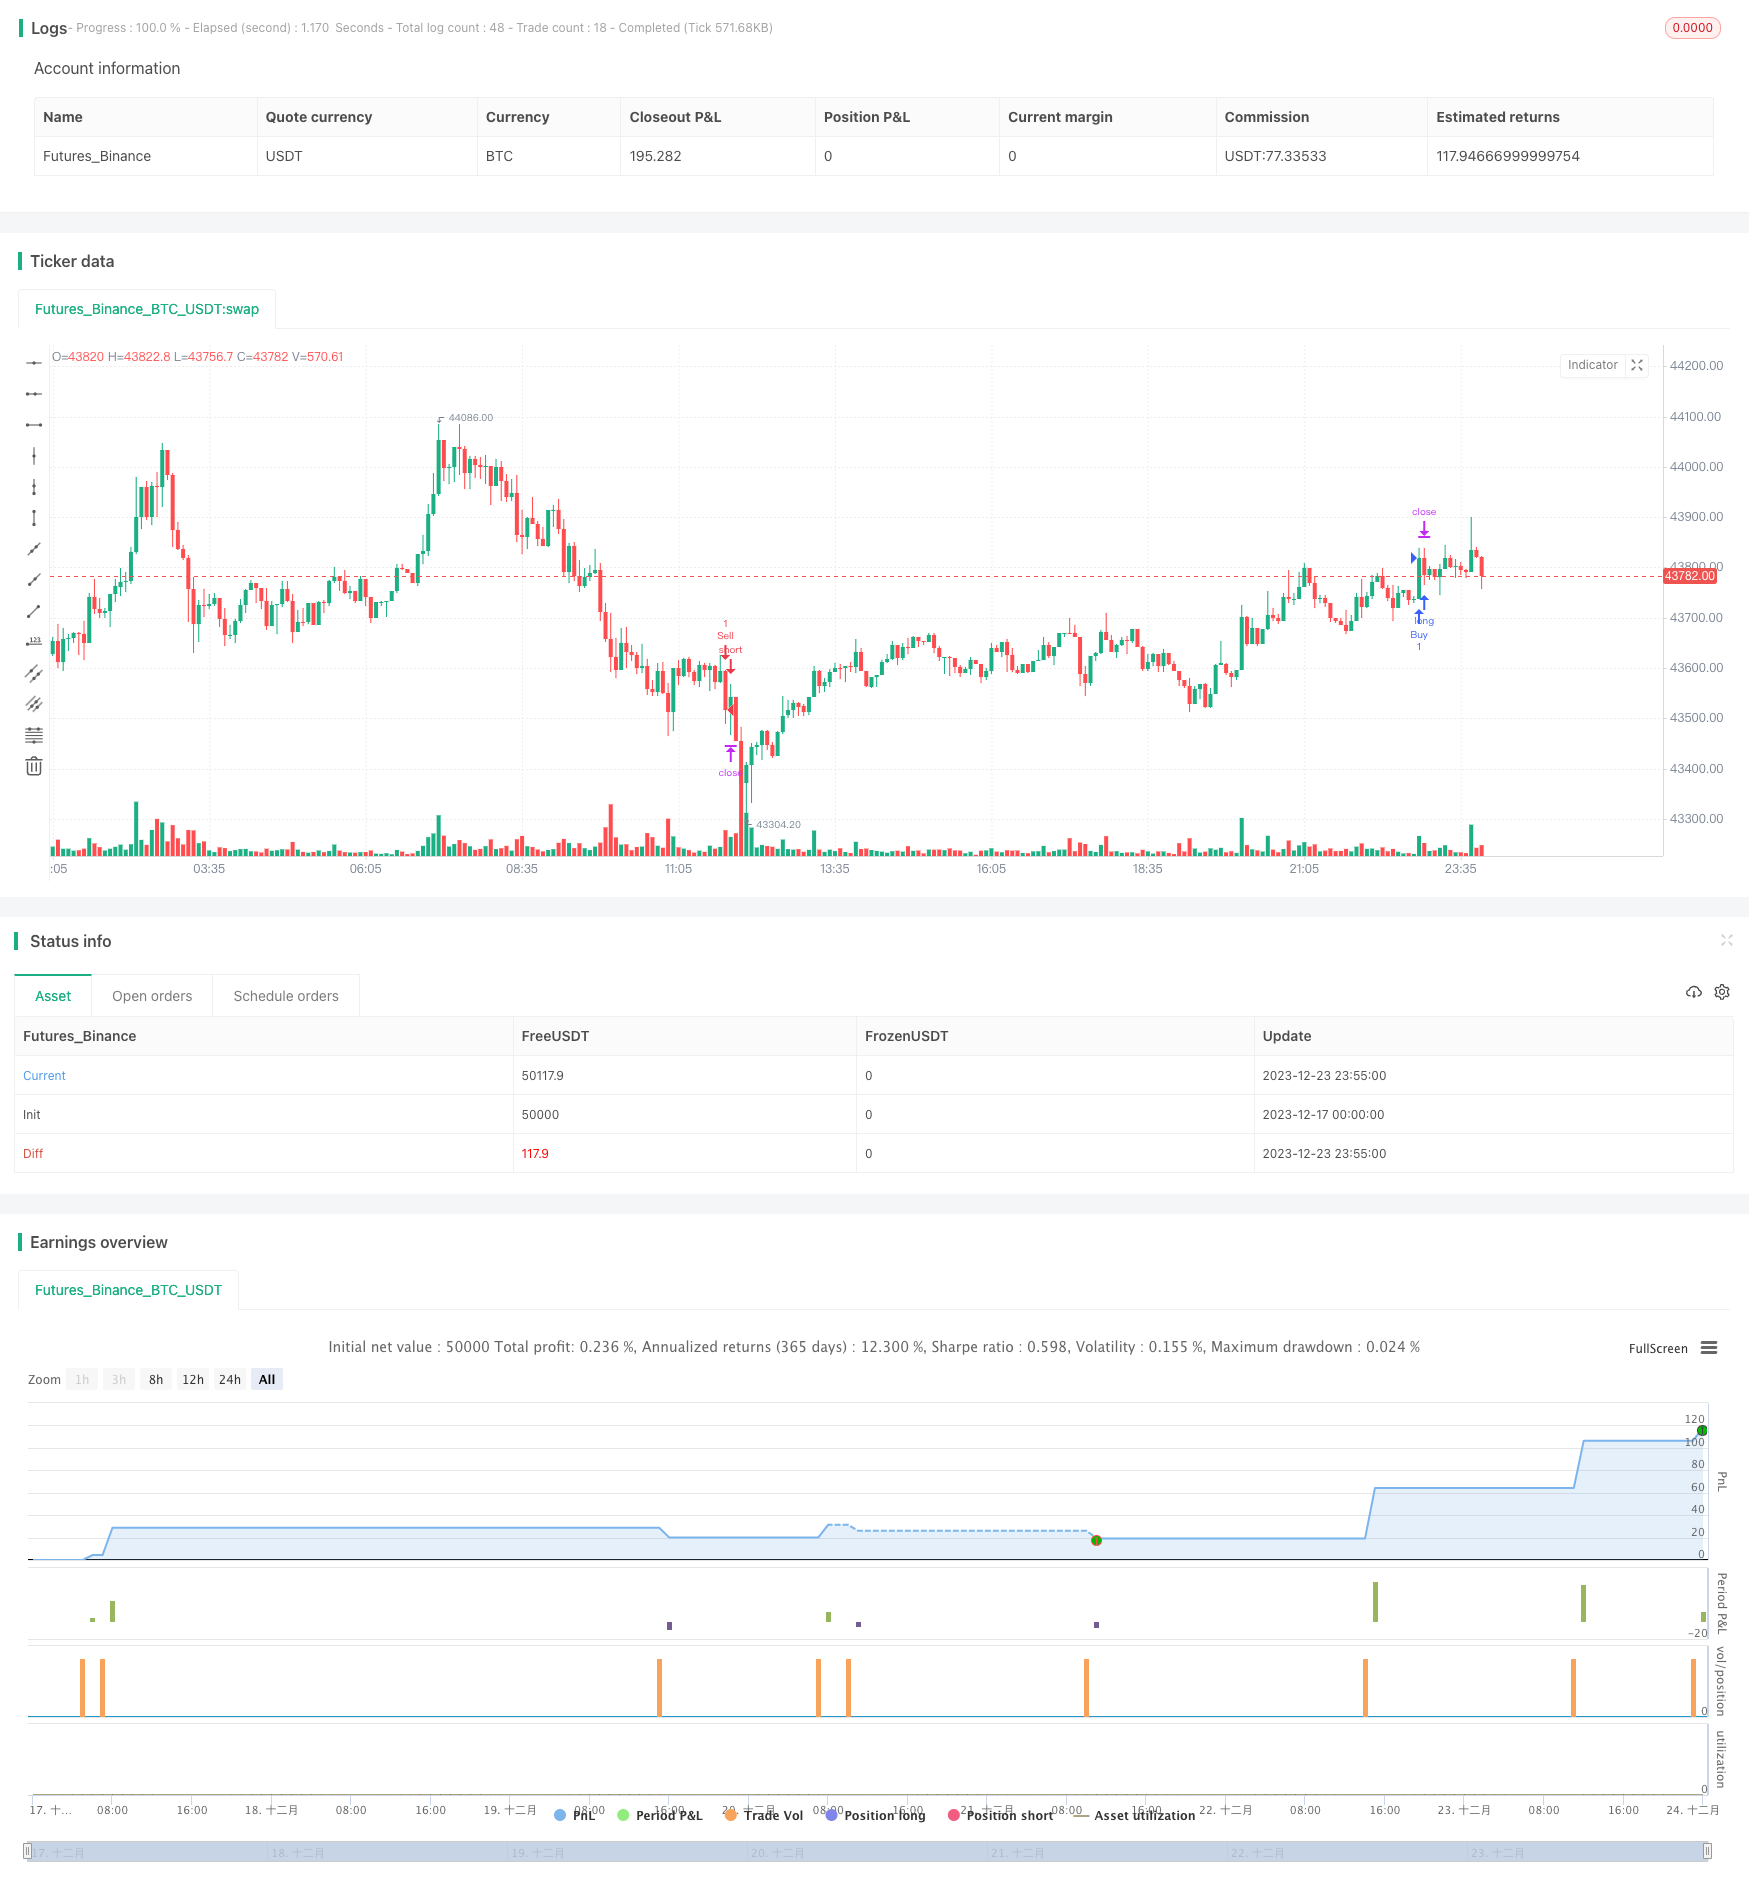
回测数据充足,收益率较高,胜率较好。
策略风险
布林带参数设置不当可能导致交易信号错误。
快慢均线交叉信号发出滞后可能带来不必要亏损。
止损点设置过于宽松,无法有效控制单笔损失。
市场可能出现极端行情导致止损点被突破。
策略优化方向
优化布林带参数,寻找最佳组合。
评估是否引入其他辅助指标过滤信号。
测试并优化移动止损策略进一步控制风险。
评估是否采用时间或价格突破方式止损。
总结
BBMA突破策略整合运用布林带和移动平均线理论判断交易信号。该策略稳定性较好,收益较高,可控的风险水平。通过参数优化和风险控制手段可进一步提升策略胜率和收益回报率。该策略适合中长线持仓交易者使用。
/*backtest
start: 2023-12-17 00:00:00
end: 2023-12-24 00:00:00
period: 5m
basePeriod: 1m
exchanges: [{"eid":"Futures_Binance","currency":"BTC_USDT"}]
*/

//@version=5
strategy("BBMA Strategy", shorttitle="BBMA", overlay=true)

// Input parameters
length = input(20, title="BBMA Length")
deviation = input(2, title="Deviation")
ema_period = input(50, title="EMA Period")
fast_ema_period = input(10, title="Fast EMA Period")
stop_loss_percentage = input.float(1, title="Stop Loss Percentage") / 100
take_profit_percentage = input.float(2, title="Take Profit Percentage") / 100

// Calculate Bollinger Bands and MTF MA
basis = ta.sma(close, length)
dev = deviation * ta.stdev(close, length)
upper_bb = basis + dev
lower_bb = basis - dev
ema = ta.ema(close, ema_period)
fast_ema = ta.ema(close, fast_ema_period)

// Entry conditions
long_condition = ta.crossover(close, upper_bb) and ta.crossover(close, fast_ema) and close > ema
short_condition = ta.crossunder(close, lower_bb) and ta.crossunder(close, fast_ema) and close < ema

// Signals for entry and exit with stop loss and take profit
if (long_condition)
    strategy.entry("Buy", strategy.long)
    strategy.exit("Take Profit/Stop Loss", from_entry="Buy", stop=close * (1 + stop_loss_percentage), limit=close * (1 + take_profit_percentage))

if (short_condition)
    strategy.entry("Sell", strategy.short)
    strategy.exit("Take Profit/Stop Loss", from_entry="Sell", stop=close * (1 - stop_loss_percentage), limit=close * (1 - take_profit_percentage))