概述
本策略名称为“RSI指标结合移动平均线的量化交易策略”。该策略运用RSI指标和移动平均线作为交易信号,实现在趋势背景下进行反转操作的量化交易策略。其核心思想是在股价出现反转信号时打开仓位,在超买超卖时进行止盈。
策略原理
该策略主要使用RSI指标和快慢移动平均线来判断股价趋势和反转时机。具体来说,策略首先计算快速移动平均线(SMA)和慢速移动平均线,当快速移动平均线上穿慢速移动平均线时产生买入信号;当快速移动平均线下穿慢速移动平均线时产生卖出信号。这表示股价趋势发生转变的迹象。
同时,本策略计算RSI指标来判断股价是否处于超买或者超卖状态。在开仓之前,会判断RSI指标是否正常,如果RSI超过设定的阈值,则暂缓开仓等待RSI回落后再开仓。这可以避免在超买超卖的不利时机建仓。另一方面,当已经持仓之后,如果RSI超过设定的止盈阈值则会平仓止盈。这可以锁定交易获利。
通过RSI指标和移动平均线的配合,可以在股价产生反转信号时打开仓位;并在超买超卖时进行止盈,实现在股价趋势背景下进行反转操作获利的量化交易策略。
策略优势
本策略具有以下优势:
可在股价反转时准确打开仓位。运用移动平均线金叉作为买入信号、死叉作为卖出信号,可准确抓住股价趋势反转机会。
可避免不利时机开仓。通过RSI指标判断超买超卖情况,可有效防止在股价短期震荡过度时建立头寸,避免不必要的浮亏。
可很好控制风险。RSI止盈可以将头寸控制在合理盈利范围,有效控制交易风险。
易于参数调优。SMA周期、RSI参数等都可以灵活调整,适应不同市场环境。
资金利用效率高。可在趋势盘整震荡阶段进行频繁交易,有效利用资金。
风险分析
本策略也存在以下风险:
跟踪误差风险。移动平均线作为趋势判断指标存在一定滞后,可能导致头寸开启时机不准确。
频繁交易风险。在震荡行情中,可能导致过于频繁地进行建仓平仓。
参数调优风险。SMA周期和RSI参数需要反复测试调整才能适应市场,不当设置可能影响策略表现。
止盈风险。RSI止盈设置不当也可能导致头寸过早离场或止盈离场后继续上涨。
优化方向
本策略的优化方向如下:
尝试运用MACD、布林线等其他指标与RSI结合,使信号更加准确可靠。
增加机器学习算法,使参数可根据历史数据自动调整,降低参数调优风险。
增加止盈策略优化机制,使止盈更加智能化,适应市场变化。
优化仓位管理策略,通过动态调整仓位规模,降低单笔交易的风险。
结合高频数据,使用 tick 级别的实时数据进行高频交易,提高策略频率。
总结
总的来说,本策略运用RSI指标和移动平均线产生交易信号,实现了一种在趋势运行过程中进行反转运算的量化策略。相比单一使用移动平均线,本策略加入RSI指标判断可有效防止不利时机开仓,并通过RSI止盈来控制交易风险,在一定程度上提高了策略稳定性。当然,本策略也存在一定改进空间,未来可从更多指标组合、参数自动优化、仓位管理等方面进行优化,使策略表现更加出色。
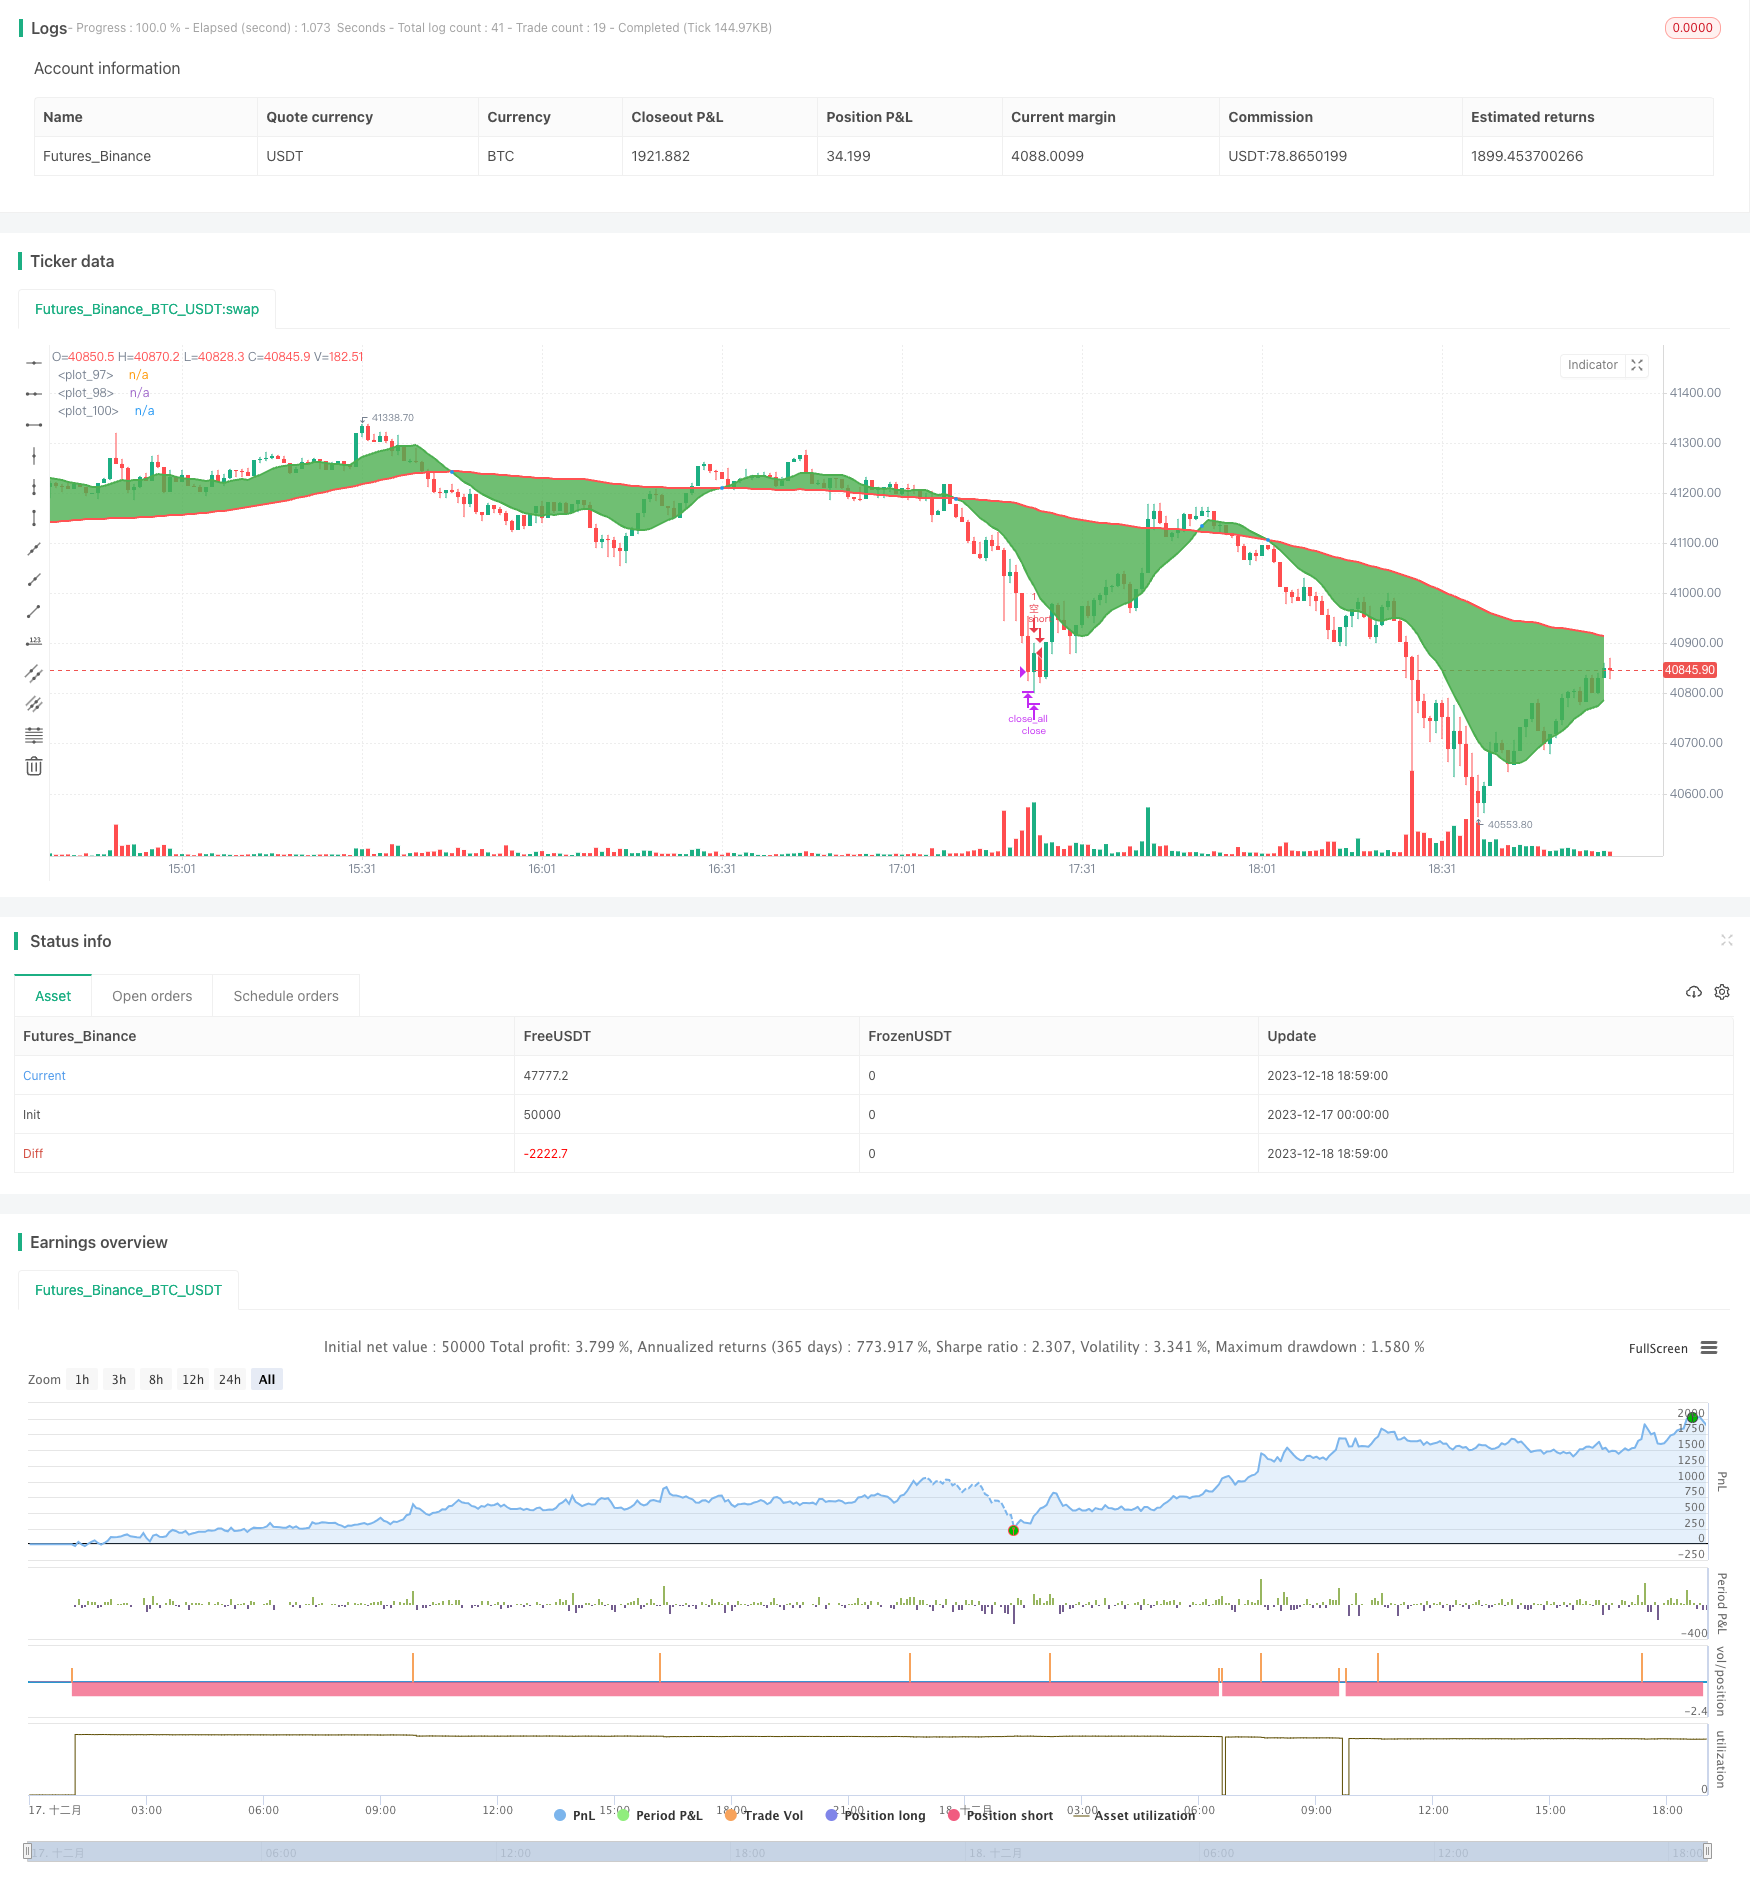
/*backtest
start: 2023-12-17 00:00:00
end: 2023-12-18 19:00:00
period: 1m
basePeriod: 1m
exchanges: [{"eid":"Futures_Binance","currency":"BTC_USDT"}]
*/

//1. 做多
//    a. RSI在超买区间时不开单,直到RSI回落一点再开单
//    b. 已经有多仓,如果RSI超买,则平多获利,当RSI回落一点之后,再次开多,直到有交叉信号反转做空

//2. 做空
//    a. RSI在超卖区间时不开单,直到RSI回落一点之后再开多单
//    b. 已经有空仓,如果RSI超卖,则平空获利,当RSI回落一点之后,再开空单,直到有交叉信号反转做多

//@version=4
strategy("策略_RSI+移动揉搓线_", overlay=true)

// 输入
fastLength = input(11, minval=1)
slowLength = input(82,minval=1)
length = input(title="长度", type=input.integer, defval=14, minval=1, maxval=100)
hight_rsi = input(title="rsi超过上轨平多获利", type=input.integer, defval=80, minval=1, maxval=100)
low_rsi = input(title="rsi超过下轨平空获利", type=input.integer, defval=20, minval=1, maxval=100)

open_long_rsi_threshold = input(title="rsi低于该阈值时才开多", type=input.integer, defval=75, minval=1, maxval=100)
open_short_rsi_threshold = input(title="rsi高于该阈值时才开空仓", type=input.integer, defval=25, minval=1, maxval=100)

// 均线
sma_fast = sma(close, fastLength)
sma_slow = sma(close, slowLength)
// RSI
rsi = rsi(close, length)

//**********变量*start*******//
var long_f = false // 标记是否是均线交叉多头
var short_f = false // 标记是否是均线交叉空头
var long_open_pending = false // 标记开仓时rsi是否处于超买状态
var short_open_pending = false // 标记开仓时rsi是否处于超卖
var long_rsi_over_buy = false // 标记 多仓时 是否发生超买平多获利
var short_rsi_over_sell = false // 标记 空仓时 是否发生超卖平空获利

//**********逻辑*start*******//

// 买入
longCondition = crossover(sma_fast, sma_slow)
if (longCondition)
    short_rsi_over_sell := false // 清空该标记,防止再次开空仓
    long_f := true
	short_f := false
	if (rsi < hight_rsi)
	    // 并且没有超买
	    strategy.entry("多", long=strategy.long)
    if (rsi > hight_rsi)
        // 开仓时发生超买,等待rsi小于hight_rsi
	    long_open_pending := true

// 卖出
shortCondition = crossunder(sma_fast, sma_slow)
if (shortCondition)
    long_rsi_over_buy := false //清空该标记,防止再次开多仓
    long_f := false
    short_f := true
    if (rsi > low_rsi)
        strategy.entry("空", long=strategy.short)
	if (rsi < low_rsi)
	    // 开仓时发生超卖,等待rsi大于low_rsi
	    short_open_pending := true


// 等待RSI合理,买入开仓
if (long_f and long_open_pending and strategy.position_size == 0 and rsi < open_long_rsi_threshold)
    strategy.entry("多", long=strategy.long)
	long_open_pending := false
// 等待RSI合理,卖出开仓
if (short_f and short_open_pending and strategy.position_size == 0 and rsi > open_short_rsi_threshold)
    strategy.entry("空", long=strategy.short)
	short_open_pending := false


//RSI止盈(RSI超买平多)
if (strategy.position_size > 0 and long_f and rsi > hight_rsi)
	strategy.close_all()
	long_rsi_over_buy := true
//RSI止盈(RSI超卖平空)
if (strategy.position_size < 0 and short_f and rsi < low_rsi)
	strategy.close_all()
	short_rsi_over_sell := true


//RSI止盈之后,再次开多
if (long_f and long_rsi_over_buy and strategy.position_size == 0 and rsi < hight_rsi)
    long_rsi_over_buy := false
    strategy.entry("多", long=strategy.long)
//RSI止盈之后,再次开空
if (short_f and short_rsi_over_sell and strategy.position_size == 0 and rsi > low_rsi)
    short_rsi_over_sell := false
    strategy.entry("空", long=strategy.short)


//**********绘图*start*******//

p1 = plot(sma_fast, linewidth=2, color=color.green)
p2 = plot(sma_slow, linewidth=2, color=color.red)
fill(p1, p2, color=color.green)
plot(cross(sma_fast, sma_slow) ? sma_fast : na, style = plot.style_circles, linewidth = 4)

// 绘制rsi线
//plot(rsi, color=color.green, editable=true, style=plot.style_circles, linewidth=2)

// 绘制上下轨
//high_ = hline(80, title="上轨")
//low_ = hline(20, title="下轨")
//fill(high_, low_, transp=80, editable=true, title="背景")