概述
该策略基于RSI指标的MACD进行交易信号生成。它结合了RSI指标判断市场超买超卖的特性,以及MACD判断市场趋势和动量变化的优势,设计出一个综合利用多种指标提供交易信号的策略。
策略原理
该策略首先计算RSI指标,然后基于RSI指标计算MACD指标。RSI指标能判断市场的超买超卖情况,MACD指标能捕捉市场趋势和动量的变化。
具体来说,策略首先计算14周期的RSI指标。然后基于RSI指标计算MACD指标,包括12周期和26周期的EMA均线,以及9周期的信号线。计算出MACD柱状图。
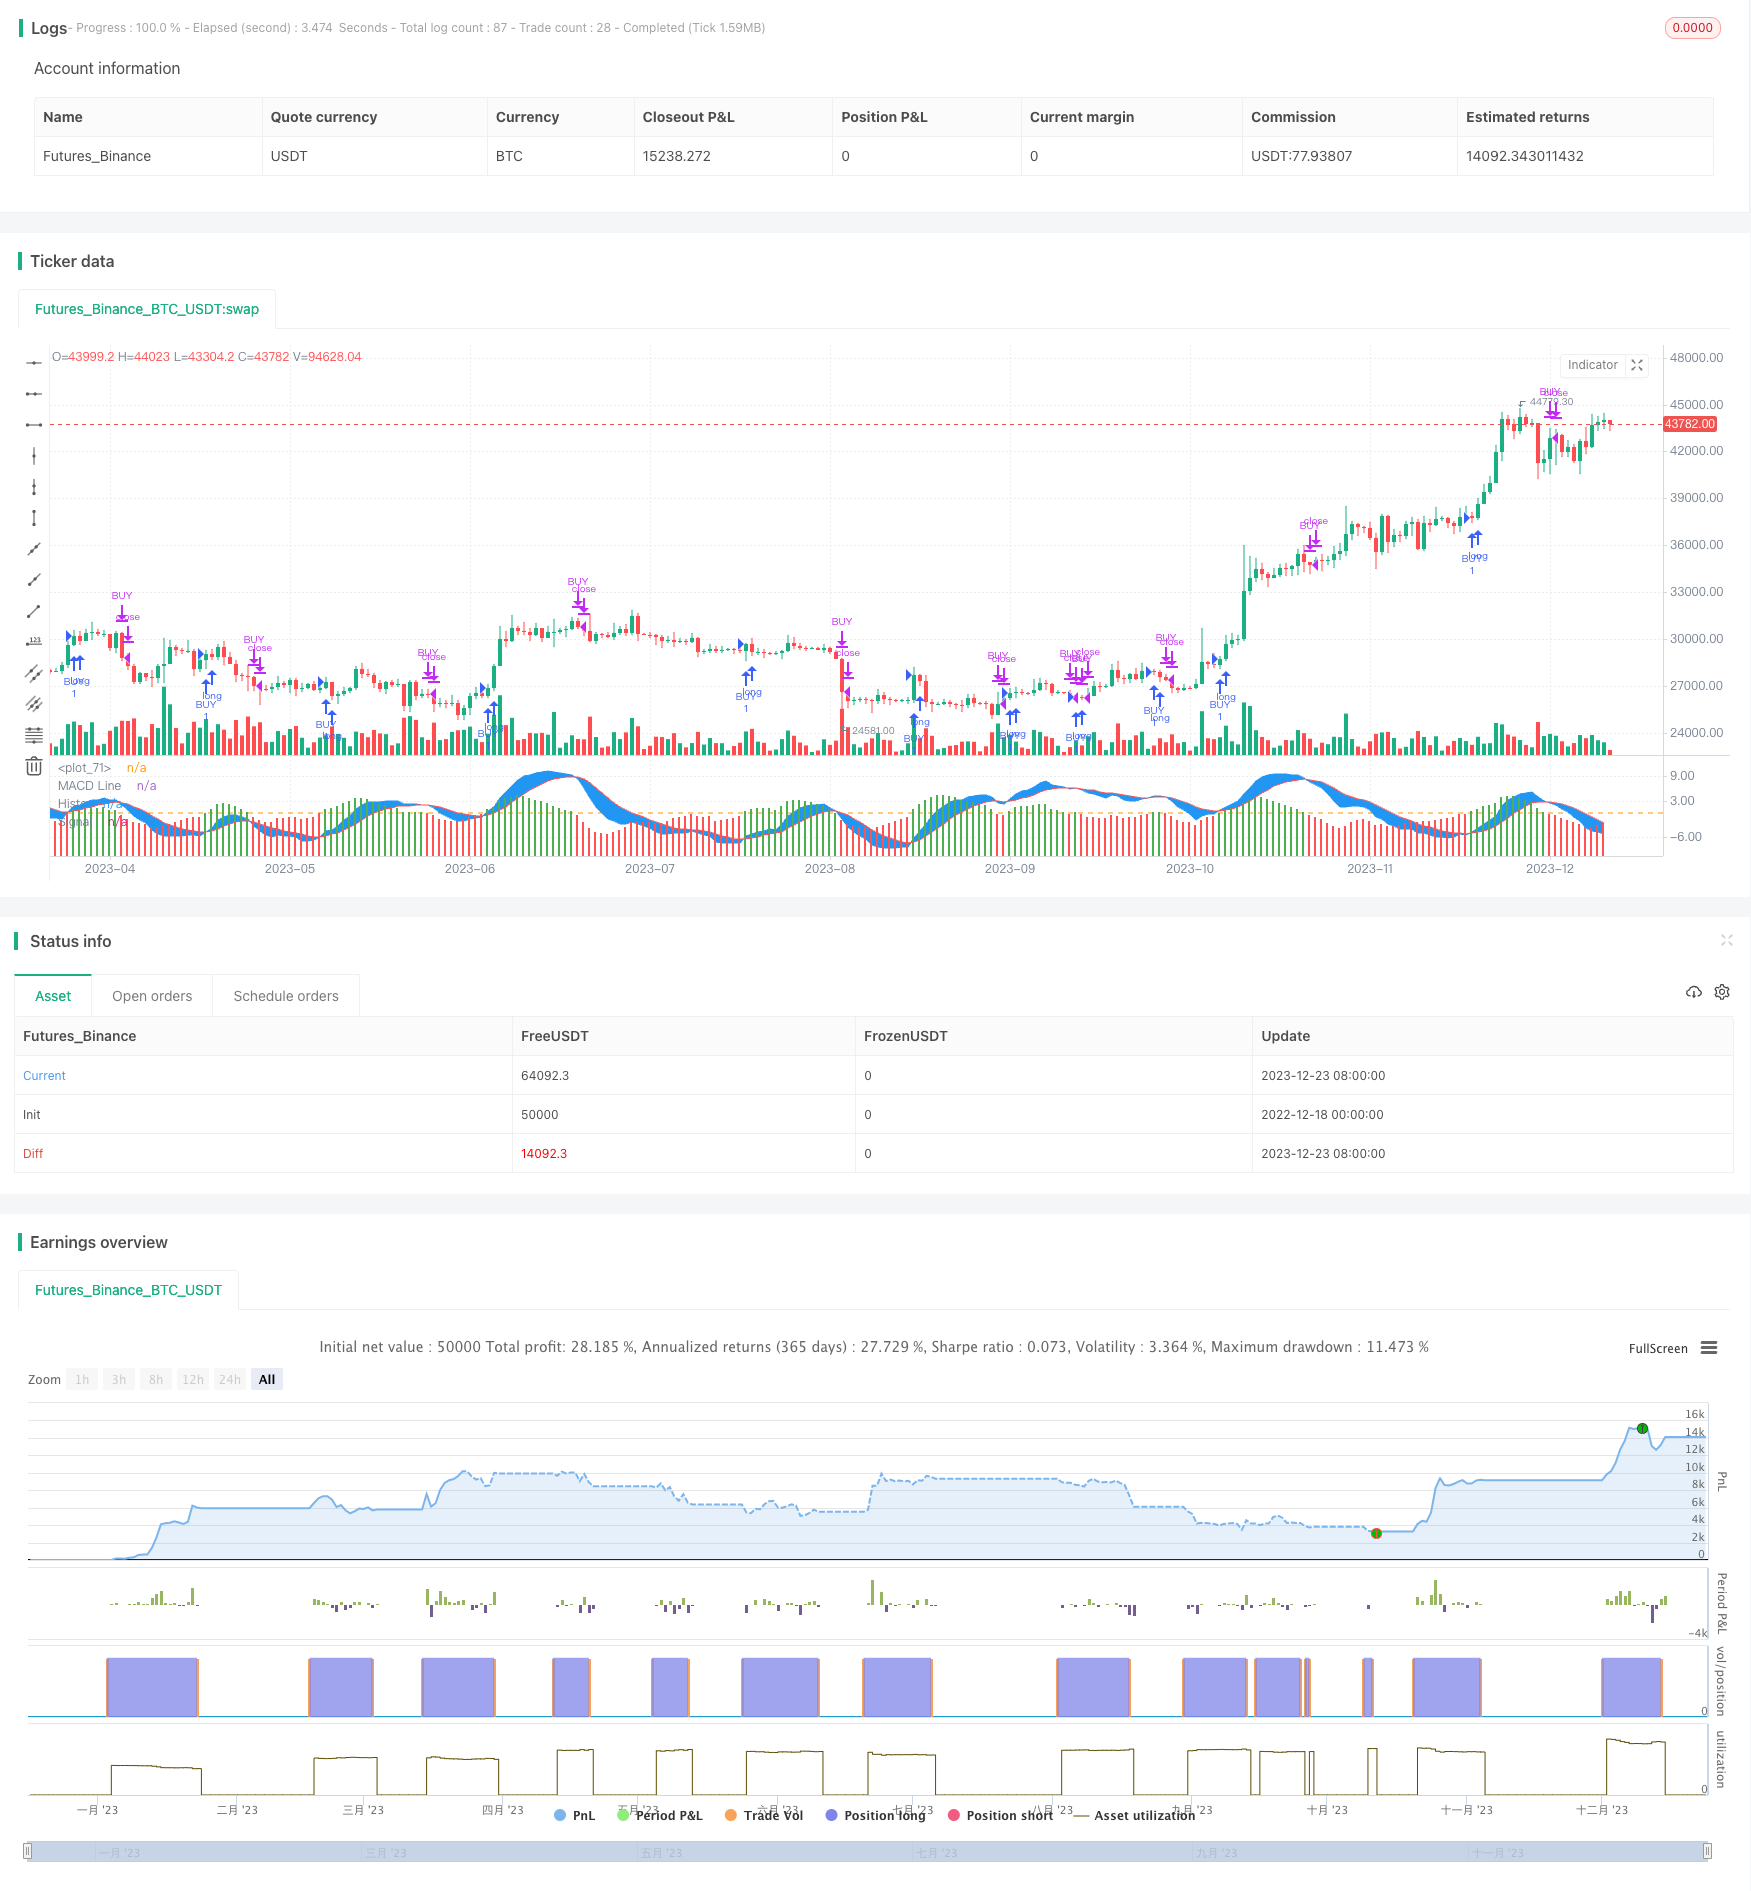
当MACD柱状图上穿0轴时产生买入信号;当MACD柱状图下穿0轴时产生卖出信号。这样就利用RSI判断市场超买超卖的同时,利用MACD判断市场趋势和动量的变化,进行交易信号的生成。
策略优势
这种策略结合了RSI和MACD两个指标的优势,可以更全面地判断市场的状态,信号也更加可靠。
利用RSI判断超买超卖状态,有助于股票选择和防止假突破。
MACD指标判断趋势和动量变化,交易信号更加明确。
RSI结合MACD,综合多种因素判断,可以过滤假信号。
策略风险
RSI和MACD的参数设置会影响策略表现,需要调整优化。
多指标组合增加了策略复杂度,也增加了出错概率。
MACD交易信号可能滞后,需要结合其他指标辅助判断。
策略优化
优化RSI和MACD的参数,找到最佳参数组合。
增加其他指标判断,如KDJ、布林带等,形成指标集群,提高信号准确性。
加入止损策略,以控制单笔损失。
优化开仓和平仓逻辑,防止冲突信号。
总结
该策略综合运用RSI和MACD两个指标的优势,形成交易信号。它判断超买超卖的同时考量趋势和动量因素,可以有效过滤假信号,信号质量较高。下一步通过参数优化、止损策略、以及加入其他指标等手段进一步完善该策略,使其信号更加准确可靠。
策略源码
/*backtest
start: 2022-12-18 00:00:00
end: 2023-12-24 00:00:00
period: 1d
basePeriod: 1h
exchanges: [{"eid":"Futures_Binance","currency":"BTC_USDT"}]
*/

//@version=3

strategy(title = "MACD of RSI", overlay = false)
//////////////////////// RSI ///////////////////////////

src = close, len = input(14, minval=1, title="Length")

up = sma(max(change(src), 0), len)

down = sma(-min(change(src), 0), len)

rsi = down == 0 ? 100 : up == 0 ? 0 : 100 - (100 / (1 + up / down))

//////////////////////// RSI   //////////////////////////

//////////////// MACD  ////////////////////////////

sourcemacd = rsi

fastLength = input(12, minval=1), slowLength=input(26,minval=1)

signalLength=input(9,minval=1)


fastMA = ema(sourcemacd, fastLength)

slowMA = ema(sourcemacd, slowLength)

macd = fastMA - slowMA

signal = ema(macd, signalLength)

delta=macd-signal

swap1 = delta>0?green:red


plot(delta,color=swap1,style=columns,title='Histo',histbase=0,transp=20)

p1 = plot(macd,color=blue,title='MACD Line')

p2 = plot(signal,color=red,title='Signal')

fill(p1, p2, color=blue)

hline(0)

/////////////////////////MACD  //////////////////////////

// Conditions

longCond = na

sellCond = na

longCond :=  crossover(delta,0)

sellCond :=  crossunder(delta,0)

monthfrom =input(6)

monthuntil =input(12)

dayfrom=input(1)

dayuntil=input(31)

if (  longCond   )

    strategy.entry("BUY", strategy.long, stop=close, oca_name="TREND", comment="BUY")

else

    strategy.cancel(id="BUY")

if ( sellCond   )

    strategy.close("BUY")