概述
本策略是一个利用双向反转动量指数指标进行交易的策略。该策略通过计算一定时间周期内的最高价、最低价、收盘价来构建一个反转动量指数,并计算其移动平均线构成交易信号。当指数从超买区反转下跌或从超卖区反转上涨时产生交易信号。该策略同时设置了突破止损机制。
策略原理
本策略的核心指标是反转动量指数(Stochastic Momentum Index,SMI)。SMI的计算公式如下:
\[SMI = \frac{Close-(HH+LL)/2}{AVGDIFF/2}*100\]
其中,HH是过去N天的最高价,LL是过去N天的最低价,N由参数a确定;AVGDIFF是HH-LL的M日移动平均,M由参数b确定。
SMI指数体现了价格反转特性。当股票价格接近最近N天的最高点时,SMI接近100,表示股票超买;当接近最近N天的最低点时,SMI接近-100,表示股票超卖。SMI从100水平反转下跌或从-100水平反转上涨时,发出买入/卖出信号。
本策略使用SMI的M日移动平均线SMA作为交易信号线。当SMI从超买区向下反转跌破SMA时,产生买入信号;当SMI从超卖区向上反转突破SMA时,产生卖出信号。
同时,策略判断K线实体突破来设置止损。
策略优势
本策略具有以下优势:
利用价格反转原理,能够在趋势反转点产生交易信号,捕捉反转机会。
SMI指数将最高价、最低价和收盘价结合在一起,综合判断超买超卖情况,信号较为可靠。
结合K线实体突破来设置止损,可以及时止损Exiting the position,有效控制风险。
策略参数较少,容易实现和优化。
策略风险
本策略也存在一些风险:
反转交易难以判断反转成功的时点,可能产生多次亏损后才捕捉到趋势反转。
反转时点判断错误可能造成损失放大。
实体突破止损可能过于灵敏,被套牢的概率较大。
对应解决方法: 1. 优化SMI参数,调整反转交易频率。
结合其他指标判断反转时点。
调整实体大小止损参数,防止过于灵敏。
策略优化
本策略可以从以下几个方向进行优化:
优化SMI的参数a和b,调整反转捕捉的灵敏度。
增加其他指标判断,避免错过主要趋势方向。比如结合均线、波动率指标等。
增加止损方式,防止止损过于灵敏或迟钝。可以考虑跟踪止损、曲线止损等。
结合机器学习模型判断反转成功概率,避免反转失败的交易。
总结
本策略整体来说是一个利用反转指数SMI进行双向交易的策略。优点是利用价格反转特性,在反转点产生交易信号,能捕捉较多短线交易机会。但也存在一些典型的反转交易风险,需要对参数和止损进行优化,防止亏损放大。总体来说,本策略适合对反转交易感兴趣的投资者,但必须用复合其他指标判断和严格止损来控制风险。
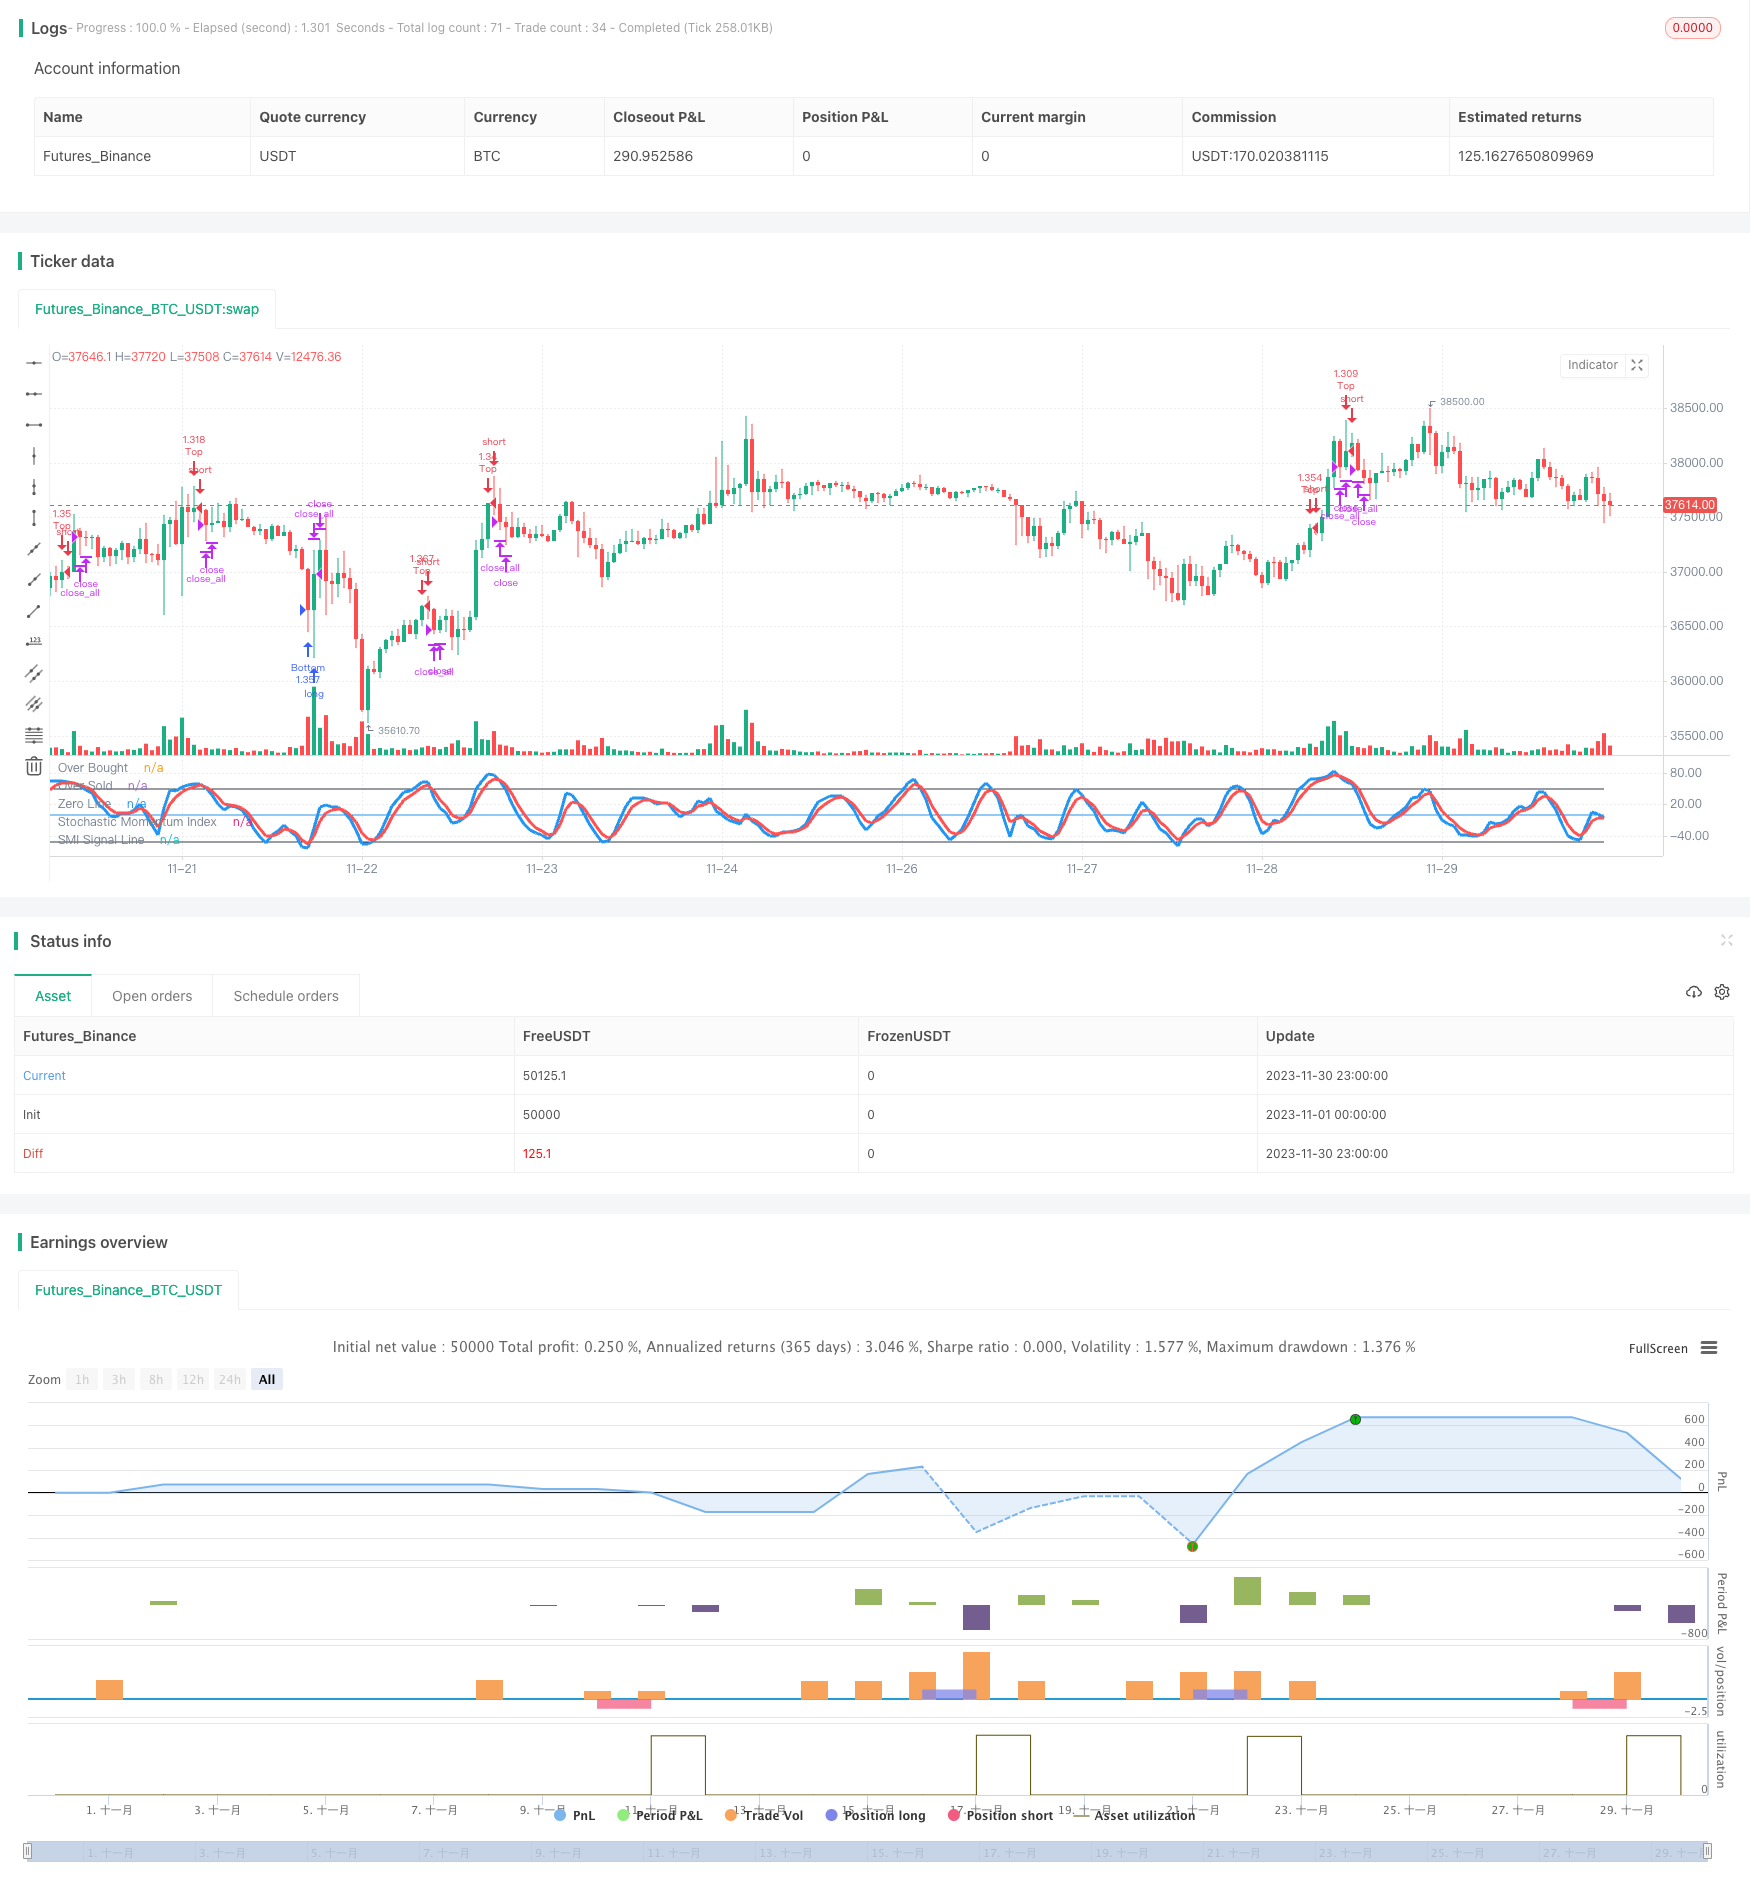
/*backtest
start: 2023-11-01 00:00:00
end: 2023-11-30 23:59:59
period: 1h
basePeriod: 15m
exchanges: [{"eid":"Futures_Binance","currency":"BTC_USDT"}]
*/

//Noro
//2018

//@version=2
strategy(title = "Noro's Stochastic Strategy v1.0", shorttitle = "Stochastic str 1.0", overlay = false, default_qty_type = strategy.percent_of_equity, default_qty_value = 100, pyramiding = 0)

//Settings
needlong = input(true, defval = true, title = "Long")
needshort = input(true, defval = true, title = "Short")
capital = input(100, defval = 100, minval = 1, maxval = 10000, title = "Capital, %")
a = input(5, "Percent K Length")
b = input(3, "Percent D Length")
limit = input(50, defval = 50, minval = 1, maxval = 100, title = "SMI Limit")
fromyear = input(2018, defval = 2018, minval = 1900, maxval = 2100, title = "From Year")
toyear = input(2100, defval = 2100, minval = 1900, maxval = 2100, title = "To Year")
frommonth = input(01, defval = 01, minval = 01, maxval = 12, title = "From Month")
tomonth = input(12, defval = 12, minval = 01, maxval = 12, title = "To Month")
fromday = input(01, defval = 01, minval = 01, maxval = 31, title = "From day")
today = input(31, defval = 31, minval = 01, maxval = 31, title = "To day")

//Stochastic Momentum Index
ll = lowest (low, a)
hh = highest (high, a)
diff = hh - ll
rdiff = close - (hh+ll)/2
avgrel = ema(ema(rdiff,b),b)
avgdiff = ema(ema(diff,b),b)
SMI = avgdiff != 0 ? (avgrel/(avgdiff/2)*100) : 0
SMIsignal = ema(SMI,b)

//Lines
plot(SMI, color = blue, linewidth = 3, title = "Stochastic Momentum Index")
plot(SMIsignal, color = red, linewidth = 3, title = "SMI Signal Line")
plot(limit, color = black, title = "Over Bought")
plot(-1 * limit, color = black, title = "Over Sold")
plot(0, color = blue, title = "Zero Line")

//Body
body = abs(close - open)
abody = sma(body, 10)

//Signals
up = SMIsignal < -1 * limit and close < open
dn = SMIsignal > limit and close > open
exit = ((strategy.position_size > 0 and close > open) or (strategy.position_size < 0 and close < open)) and body > abody / 2

//Trading
lot = strategy.position_size == 0 ? strategy.equity / close * capital / 100 : lot[1]

if up
    if strategy.position_size < 0
        strategy.close_all()

    strategy.entry("Bottom", strategy.long, needlong == false ? 0 : lot)

if dn
    if strategy.position_size > 0
        strategy.close_all()

    strategy.entry("Top", strategy.short, needshort == false ? 0 : lot)

if  exit
    strategy.close_all()