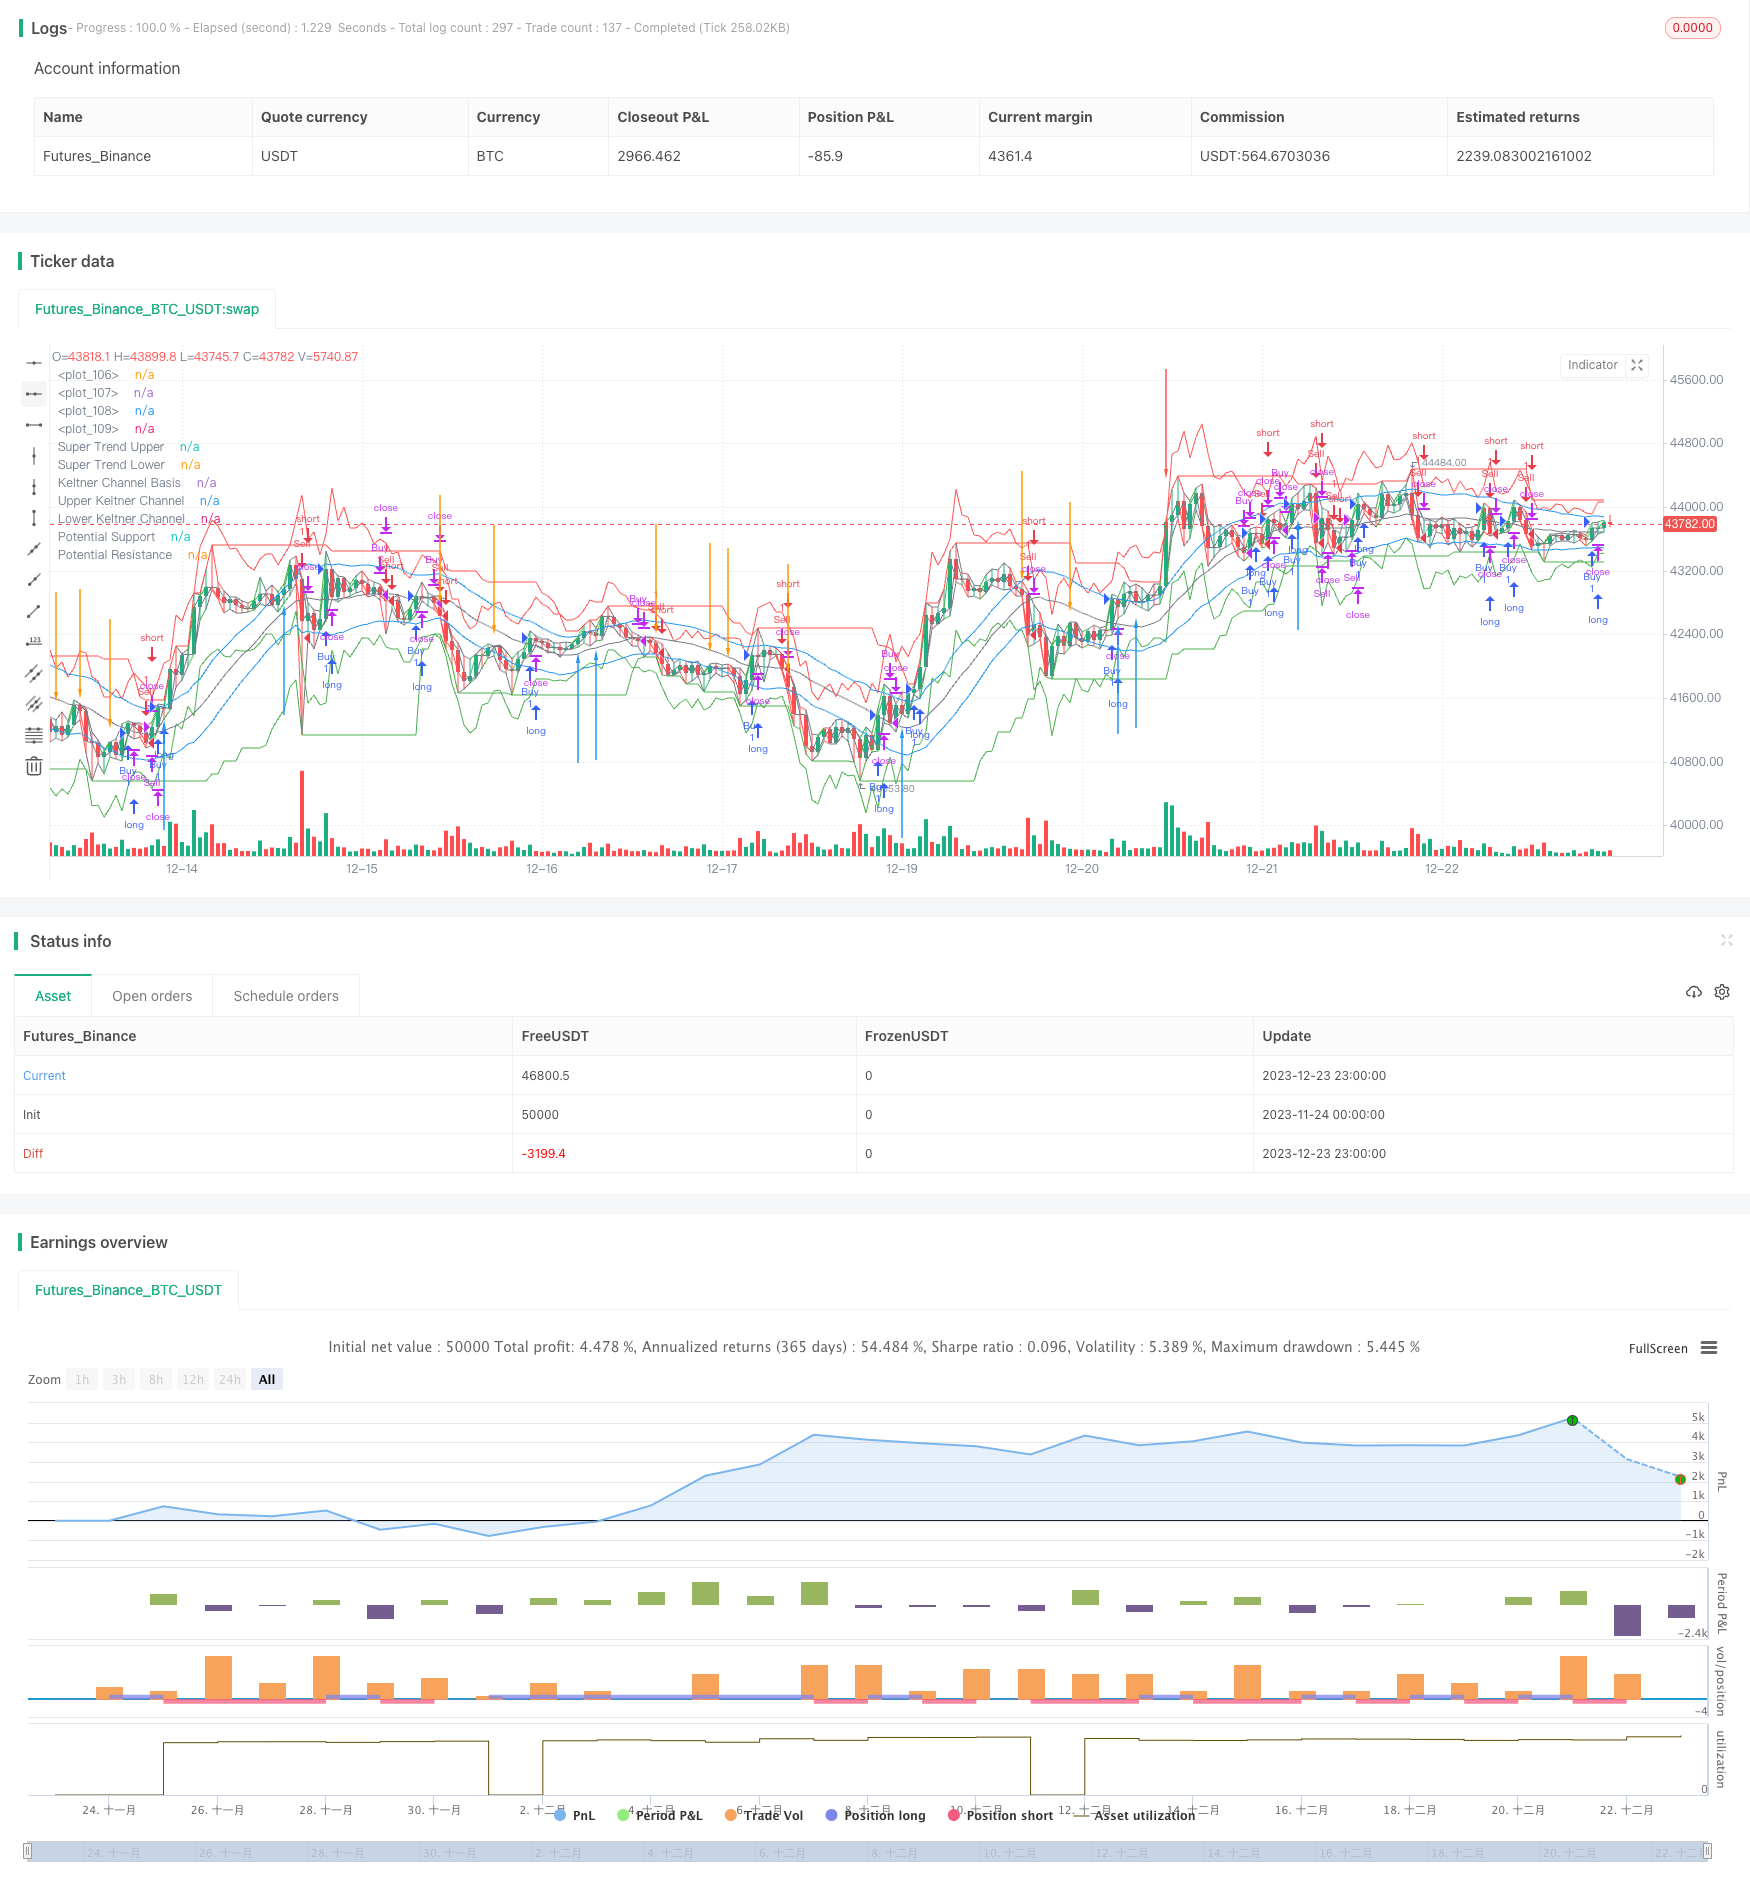
概述: 本策略综合运用动态移动平均线、超级趋势指标、潜在支持与阻力位和克尔特通道,对价格变动进行多层次判断,实现自动化的趋势追踪交易。策略优点是交易信号生成清晰,胜率较高,同时结合风险管理措施,可控制单笔交易风险。
策略原理: 本策略运用动态移动平均线判断价格中短期趋势方向。具体来说,根据用户选择,脚本采用简单移动平均线或指数移动平均线。当最高价、最低价和收盘价均高于昨日时,判定为多头趋势;当最高价、最低价和收盘价均低于昨日时,判定为空头趋势。基于此,结合动态移动平均线的位置,生成买入和卖出信号。
此外,策略还运用超级趋势指标识别长期趋势。超级趋势指标结合平均真实波动幅度,当价格运行于上轨之上且昨日收盘价低于上轨时产生买入信号。当价格跌破下轨且昨日收盘价高于下轨时产生卖出信号。
为过滤假信号,本策略运用克尔特通道绘制通道上下轨。结合通道范围与超级趋势指标,可实现趋势追踪交易。具体来说,当价格由下向上突破上轨,且昨日收盘价低于上轨时产生强势买入信号;当价格由上向下跌破下轨,且昨日收盘价高于下轨时产生强势卖出信号。
此外,脚本还辅助绘制了潜在支持与阻力位,进一步确定关键价格位。总体而言,多层指标组合,严格的突破条件,从根本上提高了交易信号的质量。
策略优势:
多策略指标组合,交易信号生成清晰。克尔特通道确定关键价格范围,结合动态移动平均线和超级趋势指标严格判定趋势方向,有效过滤市场假突破。
严格的突破条件确保交易信号质量。价格需真正突破通道上下轨,同时结合昨日收盘价的位置,避免被套。
超级趋势指标可捕捉长期趋势,追踪长线方向性行情。
潜在支持与阻力位辅助判断价格关键点,可发现反转机会。
整体交易频率适中,不会过于密集交易。只在关键点发出高质量信号,胜率较高。
策略风险:
在震荡行情中,指标可能发出误导信号,导致无效突破交易亏损。可通过调整参数优化,或人工干预退出SetPosition。
突破通道上下轨的止损点可能过大,单笔亏损风险偏高。可适当缩小止损范围,或采用时间止损。
追踪长线趋势时,可能错过部分中短线反转机会。可辅助采用震荡指标判断局部调整。
移动平均线系统有时对突发事件反应较慢。这时可考虑降低移动平均线参数,或采用其他指标辅助。
策略优化方向: 根据不同市场环境和交易偏好,本策略可从以下几个方向进行优化:
调整移动平均线参数,优化指标系统对价格变动的敏感度。
调整超级趋势指标的ATR周期和因子参数,优化超级趋势指标的作用。
调整止损点,平衡每单盈亏比例。也可利用时间止损进一步控制单笔亏损风险。
增加其他辅助指标,如布林带、KD指标等,进一步判断局部调整与反转机会。
利用open、close等变量绘制K线图形,直观判断价格行情。
进行参数优化、回测比对不同参数组合的效果。
总结: 本策略综合运用动态移动平均线、超级趋势指标和克尔特通道等多重指标,实现自动化的趋势跟踪交易。关键优势有:信号生成清晰,胜率较高;追踪长线趋势,捕捉方向性机会;止损点合理,控制单笔亏损风险。有效的多指标组合严格过滤假突破,确保发出的交易信号质量较高,适合自动化交易。通过参数调整和优化,本策略可适应不同市场环境,并可辅助人工决策找到交易时机。
/*backtest
start: 2023-11-24 00:00:00
end: 2023-12-24 00:00:00
period: 1h
basePeriod: 15m
exchanges: [{"eid":"Futures_Binance","currency":"BTC_USDT"}]
*/

// This Pine Script™ code is subject to the terms of the Mozilla Public License 2.0 at https://mozilla.org/MPL/2.0/
// © mahesh_linux1989

//@version=5
strategy("Intraday Trend Identifier with Dynamic Moving Averages, Super Trend, VWAP, and Keltner Signals", overlay=true, shorttitle="ITI Keltner")

// Input for Moving Average Type
maType = input("SMA", title="Moving Average Type")

// Input for SMA Length
smaLength = input.int(20, title="SMA Length", minval=1, maxval=200)

// Input for EMA Length
emaLength = input.int(20, title="EMA Length", minval=1, maxval=200)

// Selecting Moving Average
selectedMA = maType == "SMA" ? ta.sma(close, smaLength) : ta.ema(close, emaLength)

// Bullish conditions
bullish = high > high[1] and low > low[1] and close > high[1]

// Bearish conditions
bearish = high < high[1] and low < low[1] and close < low[1]

// Strategy logic
longCondition = bullish and not bearish and close > selectedMA
shortCondition = bearish and not bullish and close < selectedMA

if (longCondition)
    strategy.entry("Buy", strategy.long)

if (shortCondition)
    strategy.entry("Sell", strategy.short)

// Exit conditions
bullishExit = close < selectedMA
bearishExit = close > selectedMA

if (bullishExit)
    strategy.close("Buy")

if (bearishExit)
    strategy.close("Sell")

// Keltner Channels
basisKC = maType == "SMA" ? ta.sma(close, smaLength) : ta.ema(close, emaLength)
atrKC = ta.atr(14)
upperKC = basisKC + atrKC
lowerKC = basisKC - atrKC

// Super Trend
atrLengthST = input.int(7, title="ATR Length for Super Trend")
factorST = input.int(2, title="Factor for Super Trend")

atrValueST = ta.atr(atrLengthST)

var float upperST = na
var float lowerST = na

if (close[1] > upperST[1])
    upperST := close[1] - factorST * atrValueST
else
    upperST := close - factorST * atrValueST

if (close[1] < lowerST[1])
    lowerST := close[1] + factorST * atrValueST
else
    lowerST := close + factorST * atrValueST

// Potential Support and Resistance
potentialSupport = ta.lowest(low, smaLength)
potentialResistance = ta.highest(high, smaLength)

// VWAP
//vwapValue = ta.vwap(close, volume)

// Keltner Signals
buySignalKC = close > upperKC and close[1] <= upperKC[1]
sellSignalKC = close < lowerKC and close[1] >= lowerKC[1]

// Super Trend Signals
buySignalST = close > upperST and close[1] <= upperST[1]
sellSignalST = close < lowerST and close[1] >= lowerST[1]

// Plotting
plot(basisKC, color=color.gray, title="Keltner Channel Basis")
plot(upperKC, color=color.blue, title="Upper Keltner Channel")
plot(lowerKC, color=color.blue, title="Lower Keltner Channel")

plot(upperST, color=color.green, title="Super Trend Upper")
plot(lowerST, color=color.red, title="Super Trend Lower")

plot(potentialSupport, color=color.green, title="Potential Support")
plot(potentialResistance, color=color.red, title="Potential Resistance")

//plot(vwapValue, color=color.orange, title="VWAP")

// Plot Bullish and Bearish arrows
plotarrow(buySignalST ? 1 : na, colorup=color.green, offset=-1, title="Bullish Arrow ST")
plotarrow(sellSignalST ? -1 : na, colordown=color.red, offset=-1, title="Bearish Arrow ST")

plotarrow(buySignalKC ? 1 : na, colorup=color.blue, offset=-1, title="Bullish Arrow KC")
plotarrow(sellSignalKC ? -1 : na, colordown=color.orange, offset=-1, title="Bearish Arrow KC")

// Plot candlesticks
plot(open, color=color.gray)
plot(close, color=bullish ? color.green : bearish ? color.red : color.gray)
plot(high, color=bullish ? color.green : bearish ? color.red : color.gray)
plot(low, color=bullish ? color.green : bearish ? color.red : color.gray)