概述
该策略结合移动平均线、布林带和相对强弱指标三个指标,进行多周期的股票交易。它在买入时会同时考虑快速移动平均线上穿慢速移动平均线、相对强弱指标低于50和收盘价低于布林带中轨这三个条件。在卖出时则会考虑相对强弱指标高于70和收盘价高于布林带上轨这两个条件。
策略原理
该策略主要利用三个指标进行判断。首先是MACD指标,它由一快一慢两个不同周期的移动平均线构成,当快线上穿慢线时产生买入信号。第二个指标是布林带,它由中轨、上轨和下轨三条线组成。当价格接近下轨时为振荡的谷部买入点,而当价格接近上轨时为须要止损的峰部。第三个指标是RSI,它反映了证券价格运动的速度和变化程度,可以找到买入谷点和卖出峰点。
在具体交易时,该策略首先要求快速移动平均线上穿慢速移动平均线,表示股价上涨势头增强,可以买入。同时要求RSI低于50,显示股价可能处于超卖区,进入买入时机。此外,还要求收盘价低于布林带中轨,表明股价处于谷部,也是比较好的买入点位。
在止盈和止损方面,当RSI高于70时,表示股价可能处于超买区,显示上涨势头减弱,应该考虑止盈了。此外,当收盘价高于布林带上轨时,也显示股价可能过高,有回落的风险,应适当止盈。
策略优势
该策略综合运用了移动平均线、布林带和RSI三个指标的优势,可以更加准确地判断买入和卖出的时机。具体优势如下:
移动平均线可以判断股价的上涨势头,布林带中轨可以找到股价的谷部买入点位,RSI可以防止买入股票高点。三者结合可以在股价上涨中期确定比较好的买入时机。
RSI和布林带上轨的结合可以很好地把握股价的峰部,避免超买现象,及时止盈。
应用多周期判断,可以在不同级别抓住交易机会,扩大获利空间。
该策略交易逻辑简单清晰,容易理解,适合中长线投资。
策略风险
尽管该策略综合多个指标判断,增加了交易决策的准确性。但仍有以下主要风险:
参数设置风险。移动平均线、布林带和RSI的参数都需要根据实际情况调整,如果参数设置不当,会影响交易效果。
多头行情适用性更好。在熊市中,股价的下跌速度更快,该策略的止损措施可能来不及起效。
单一股票风险。该策略更适合投资组合,单一股票风险依然存在,需要分散投资。
交易频率可能过高。如果参数设置得当,该策略可能会频繁交易。这会增加交易成本和税费。
对应解决方法:
应根据回测数据调整参数,使指标发出信号的频率更加合适。
可以适当调整移动平均线周期,降低买入频率,减小亏损。
增加投资品种,通过分散投资降低单一股票风险。
适当放宽买入和止盈条件,降低交易频率。
策略优化方向
该策略仍有进一步优化的空间:
可以引入更多指标过滤,如成交量指标,确保买入时成交量放大,增加决策准确性。
可以添加仓位管理模块,根据市场情况动态调整仓位。
可以结合深度学习算法,通过对大量数据的训练,自动优化参数设置。
可以加入更多时间周期判断,扩大适用面。
总结
该策略总体来说逻辑清晰、易于理解,综合运用多个指标判断,在一定程度上减少了假信号。通过参数优化和加入更多技术指标,可以进一步提高决策准确性,增强策略健壮性。该策略比较适合中长线投资,也可用于量化交易。但任何策略都不能完全规避市场风险,需要控制好仓位大小和止损点位。
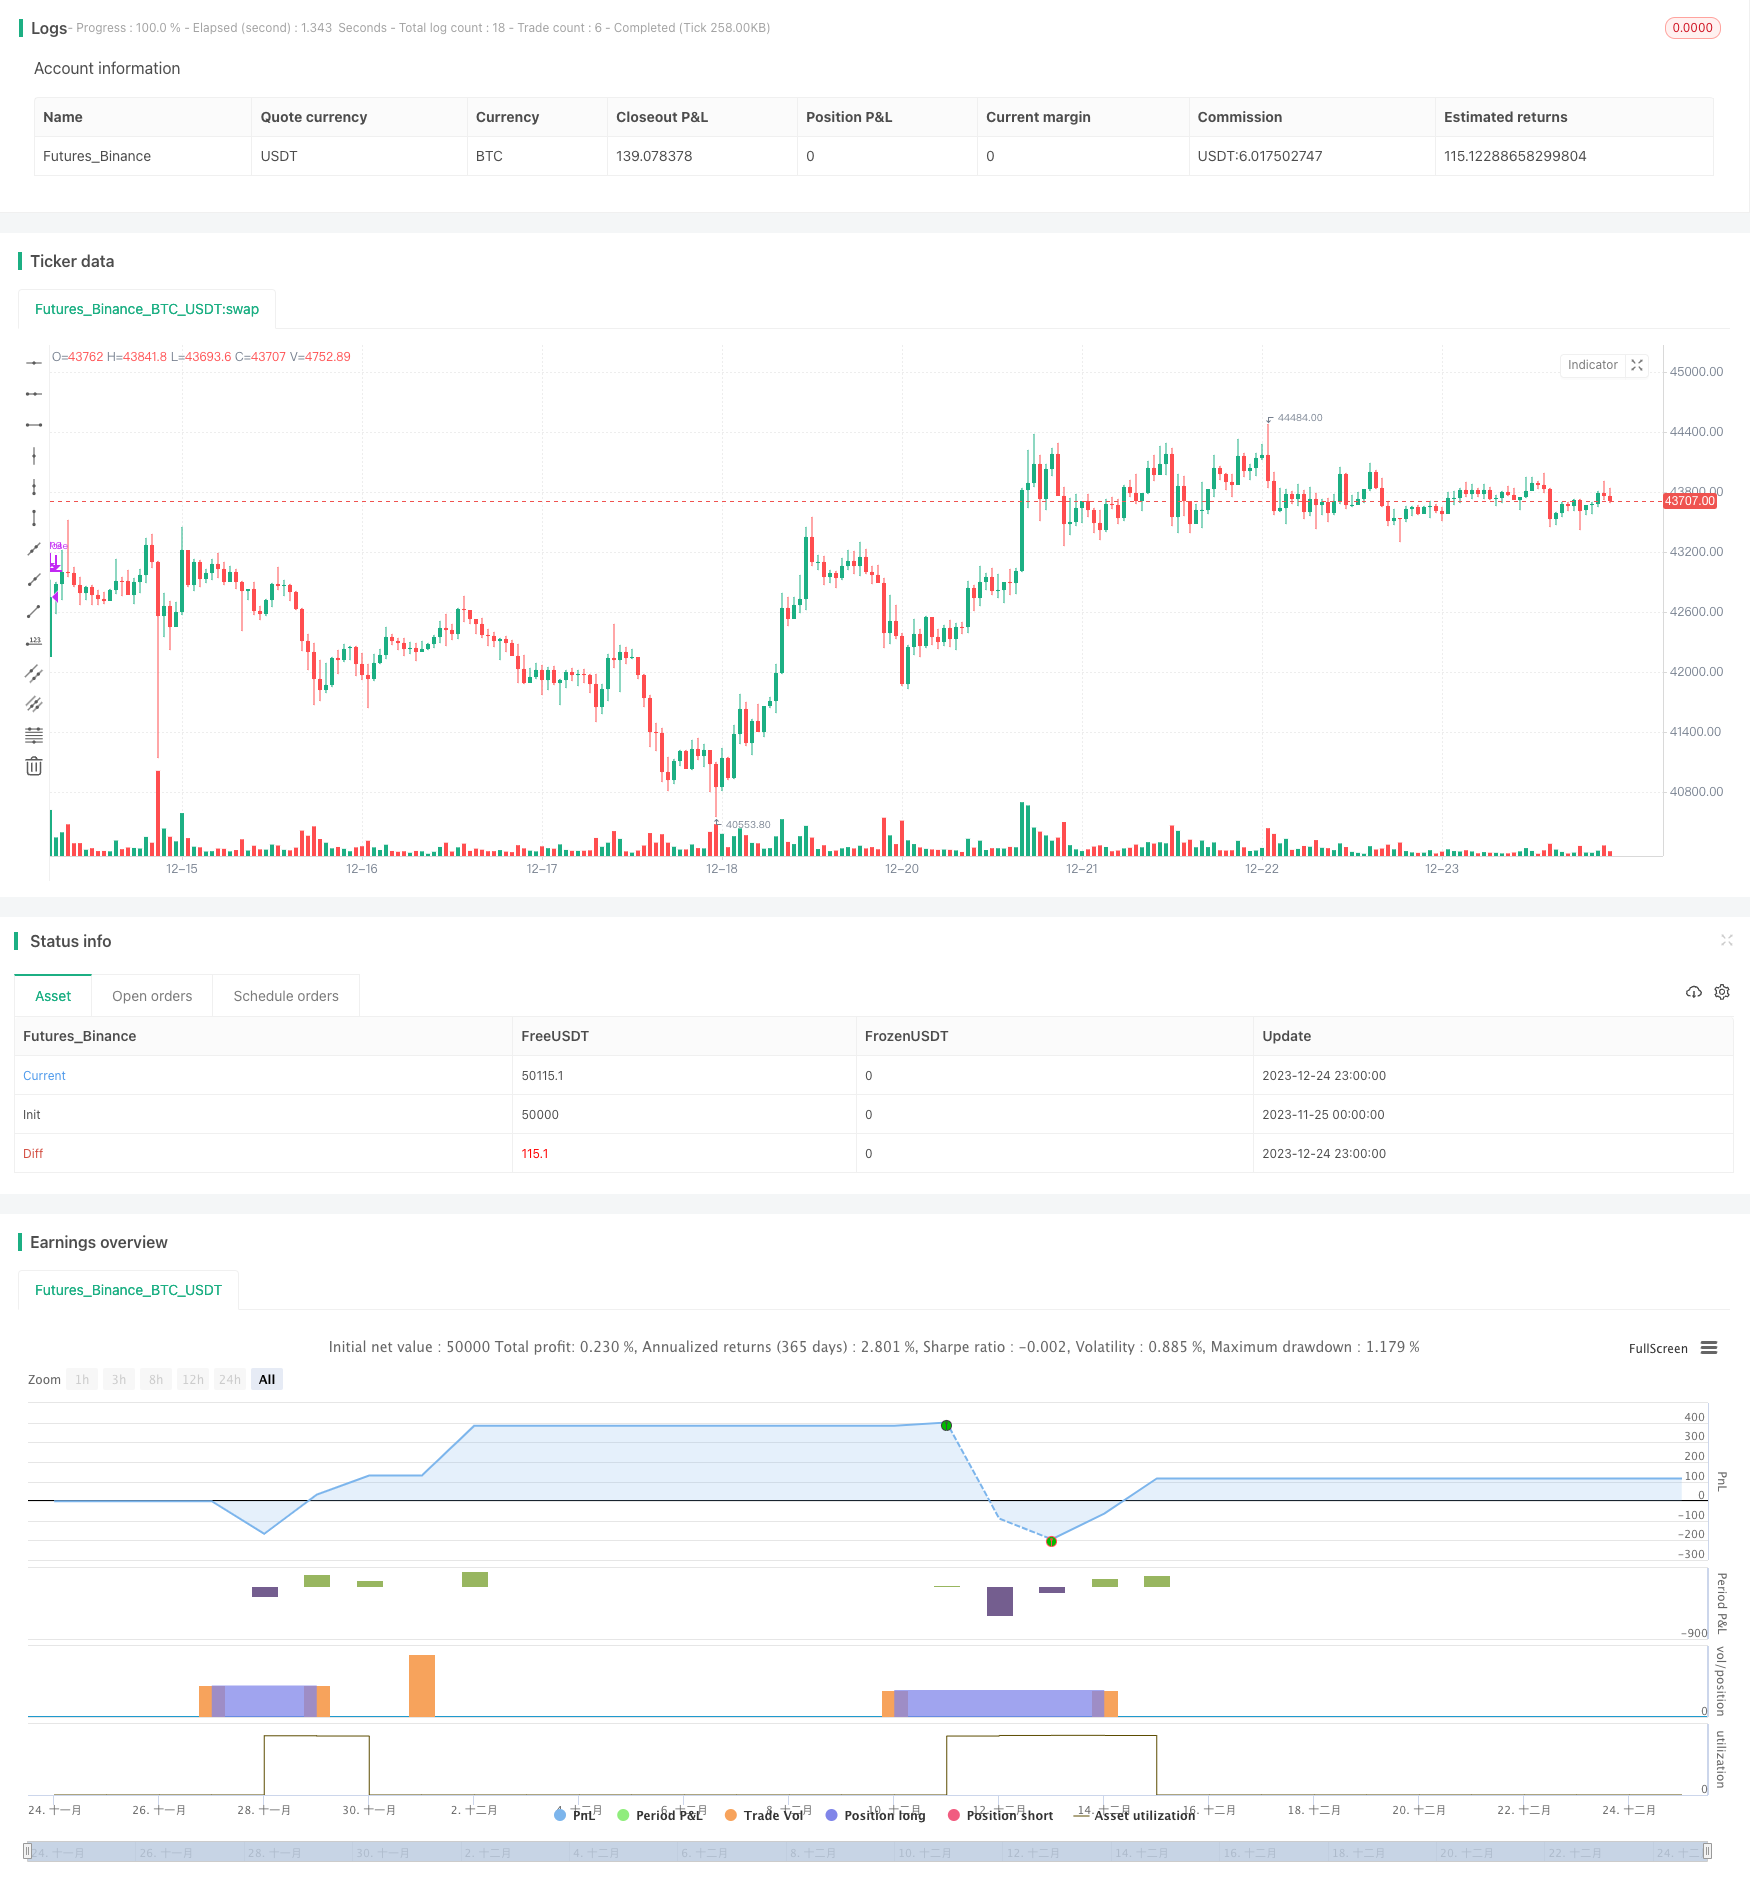
/*backtest
start: 2023-11-25 00:00:00
end: 2023-12-25 00:00:00
period: 1h
basePeriod: 15m
exchanges: [{"eid":"Futures_Binance","currency":"BTC_USDT"}]
*/

//
//@author Alorse
//@version=4
strategy("MACD + BB + RSI [Alorse]", shorttitle="BB + MACD + RSI [Alorse]", overlay=true, pyramiding=0, currency=currency.USD, default_qty_type=strategy.percent_of_equity, initial_capital=1000, default_qty_value=20, commission_type=strategy.commission.percent, commission_value=0.01)

txtVer = "1.0.1"
version = input(title="Version", type=input.string, defval=txtVer, options=[txtVer], tooltip="This is informational only, nothing will change.")
src = input(title="Source", type=input.source, defval=close)

// MACD
fast_length = input(title="Fast Length", type=input.integer, defval=12, group="MACD")
slow_length = input(title="Slow Length", type=input.integer, defval=26, group="MACD")
signal_length = input(title="Signal Smoothing", type=input.integer, minval = 1, maxval = 50, defval = 9, group="MACD")
sma_source = input(title="Oscillator MA Type", type=input.string, defval="EMA", options=["SMA", "EMA"], group="MACD")
sma_signal = input(title="Signal Line MA Type", type=input.string, defval="EMA", options=["SMA", "EMA"], group="MACD")
fast_ma = sma_source == "SMA" ? sma(src, fast_length) : ema(src, fast_length)
slow_ma = sma_source == "SMA" ? sma(src, slow_length) : ema(src, slow_length)
macd = fast_ma - slow_ma
signal = sma_signal == "SMA" ? sma(macd, signal_length) : ema(macd, signal_length)

// Bollinger Bands
bbGroup = "Bollindger Bands"
length = input(20, title="Length", group=bbGroup)
mult = input(2.0, title="StdDev", minval=0.001, maxval=5, group=bbGroup)

basis = sma(src, length)
dev = mult * stdev(src, length)
upper = basis + dev
lower = basis - dev

// RSI
rsiGroup = "RSI"
lenRSI = input(14, title="Length", minval=1, group=rsiGroup)
// lessThan = input(50, title="Less than", minval=1 , maxval=100, group=rsiGroup)
RSI = rsi(src, lenRSI)

// Strategy Conditions
buy = crossover(macd, signal) and RSI < 50 and close < basis
sell = RSI > 70 and close > upper


// Stop Loss
slGroup = "Stop Loss"
useSL = input(false, title="╔══════   Enable   ══════╗", group=slGroup, tooltip="If you are using this strategy for Scalping or Futures market, we do not recommend using Stop Loss.")
SLbased = input(title="Based on", type=input.string, defval="Percent", options=["ATR", "Percent"], group=slGroup, tooltip="ATR: Average True Range\nPercent: eg. 5%.")
multiATR = input(10.0, title="ATR   Mult", type=input.float, group=slGroup, inline="atr")
lengthATR = input(14, title="Length", type=input.integer, group=slGroup, inline="atr")
SLPercent = input(10, title="Percent", type=input.float, group=slGroup) * 0.01

longStop = 0.0
shortStop = 0.0

if SLbased == "ATR"
    longStop := valuewhen(buy, low, 0) - (valuewhen(buy, rma(tr(true), lengthATR), 0) * multiATR)
    longStopPrev = nz(longStop[1], longStop)
    longStop := close[1] > longStopPrev ? max(longStop, longStopPrev) : longStop

    shortStop := (valuewhen(sell, rma(tr(true), lengthATR), 0) * multiATR) + valuewhen(sell, high, 0)
    shortStopPrev = nz(shortStop[1], shortStop)
    shortStop := close[1] > shortStopPrev ? max(shortStop, shortStopPrev) : shortStop
if SLbased == "Percent"
    longStop  := strategy.position_avg_price * (1 - SLPercent)
    shortStop := strategy.position_avg_price * (1 + SLPercent)

strategy.entry("Long", true, when=buy)
strategy.close("Long", when=sell, comment="Exit")

if useSL
    strategy.exit("Stop Loss", "Long", stop=longStop)