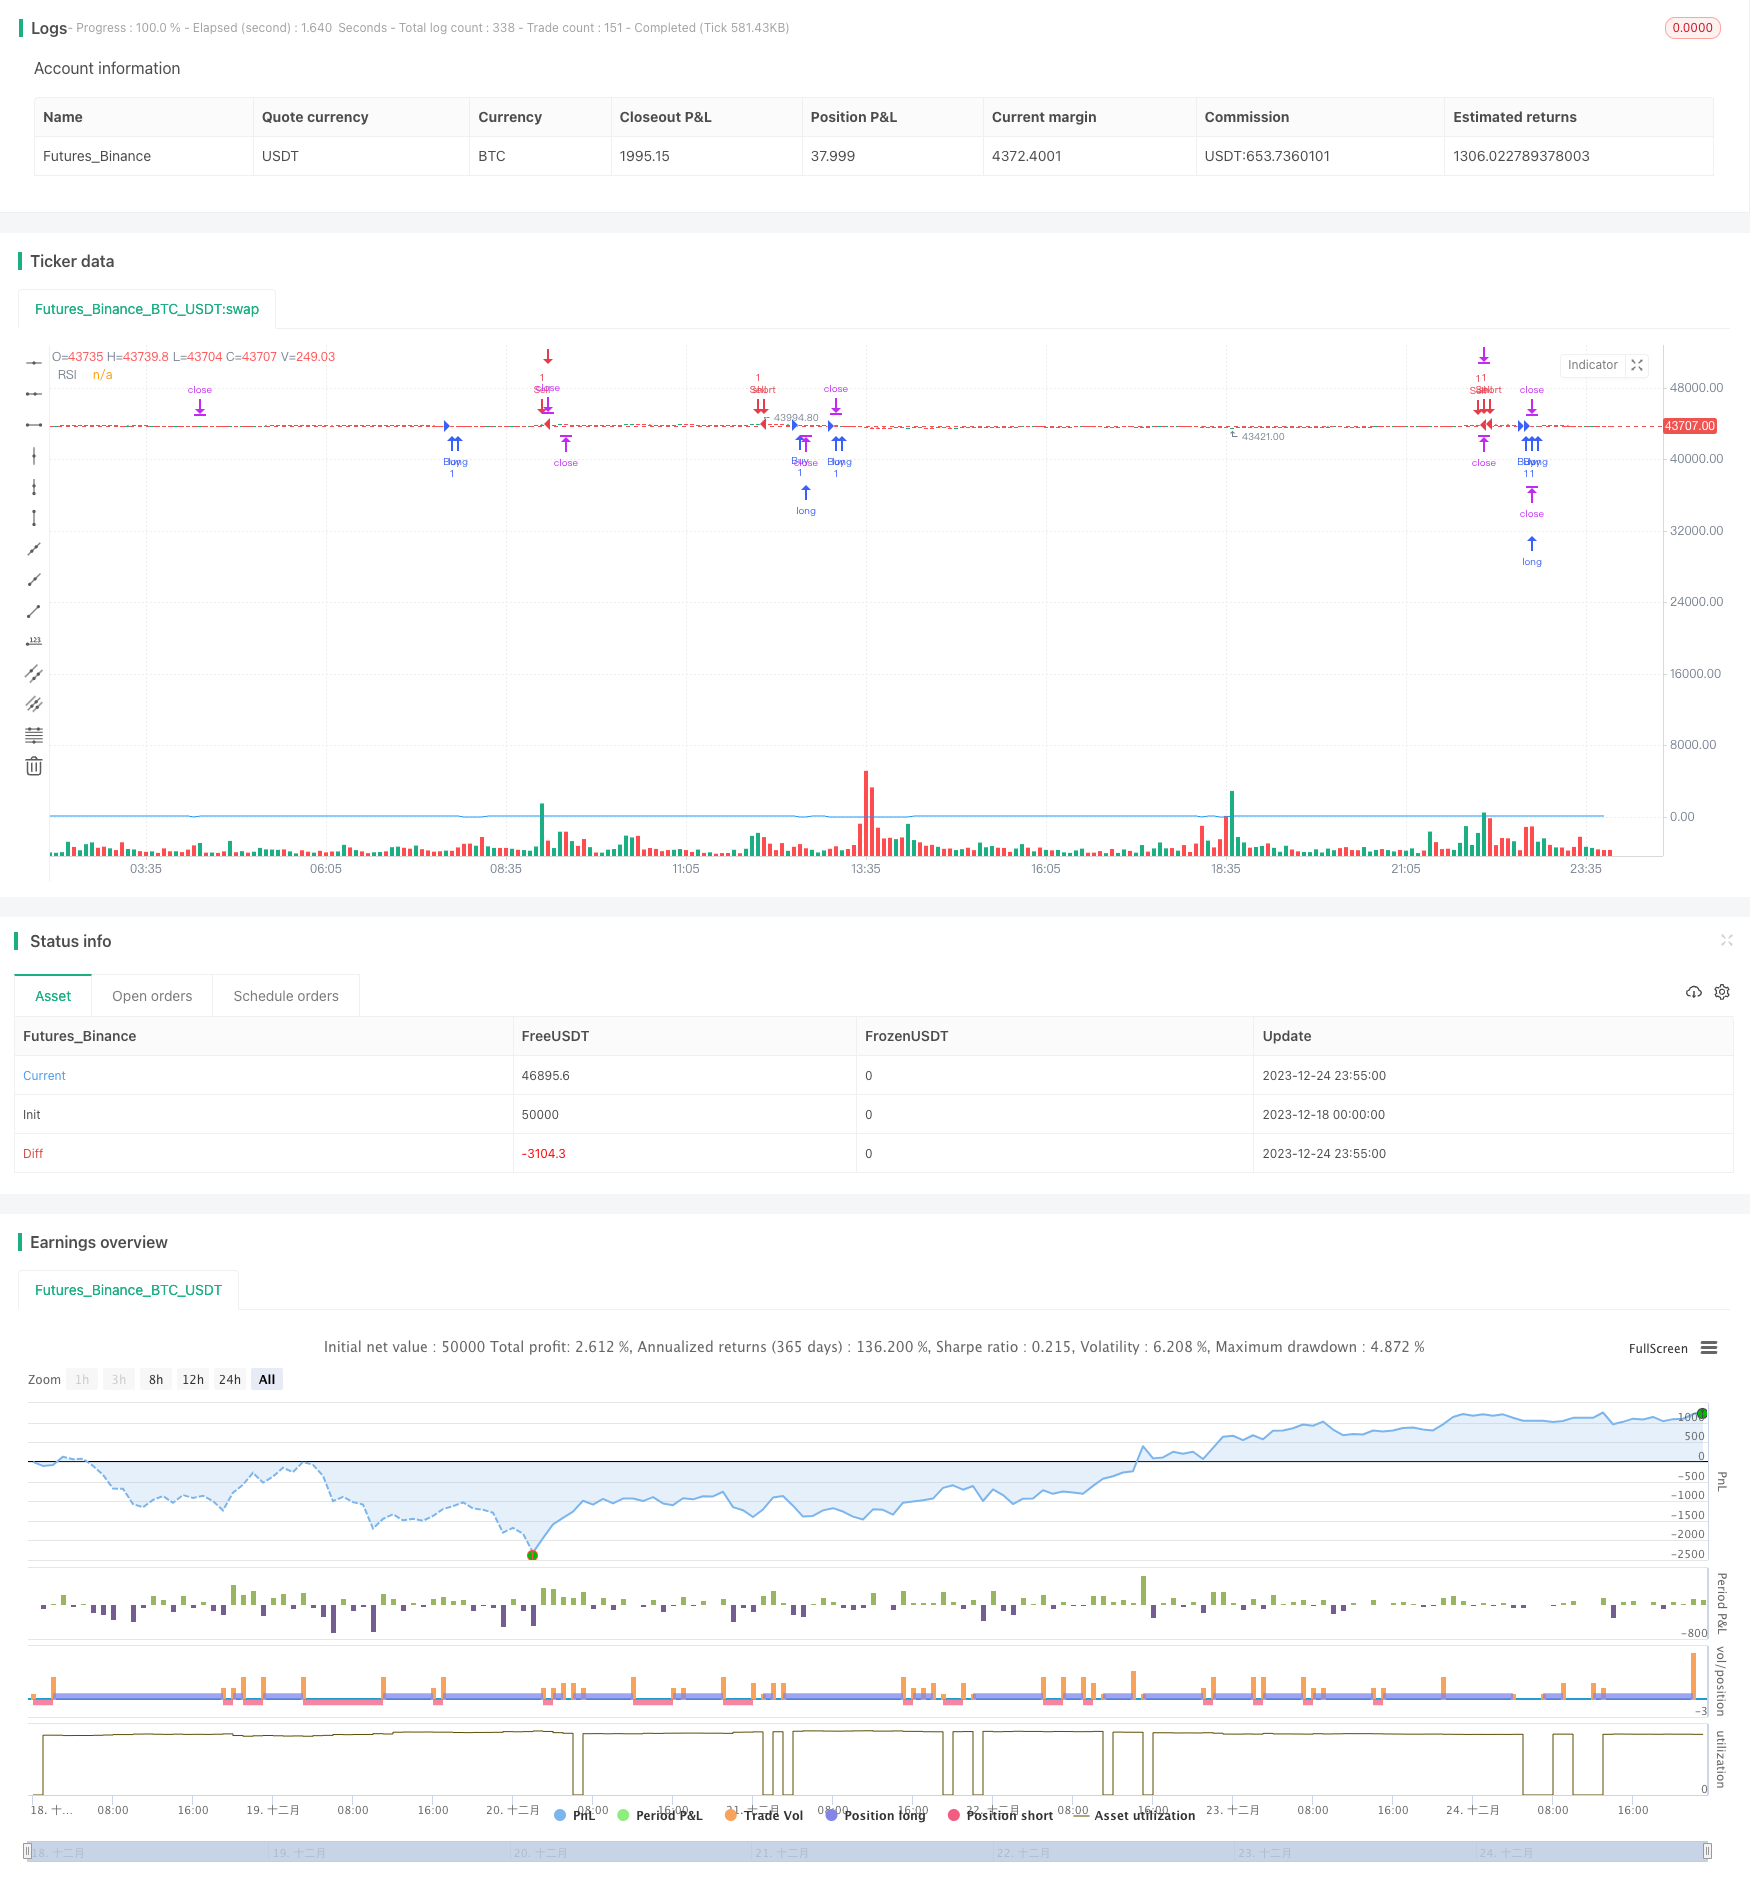
概述
该策略基于相对强度指数(RSI)指标,结合止损和日损失限制机制,实现对英伟达股票的算法交易。其交易决策依赖RSI指标识别超买超卖信号,进而建立做多做空仓位。同时,策略设置止损点以限制单笔损失,并规定最大日损失百分比以控制总体风险。
策略原理
当RSI指标低于超卖阈值37时,认为股价被低估,此时做多;当RSI高于超买阈值75时,认为股价被高估,此时做空。股票涨跌超过事先设定的止损点时止损退出。若一天内净值最大损失达到3%,则平仓止损,不再开仓交易。
该策略主要依赖RSI指标判断买卖时机。RSI低于30时为超卖信号,代表股价被低估;而RSI超过70时为超买信号,意味着股价被高估。策略在超买超卖点开仓做空做多,依靠股价反转获利离场。
止损机制用于控制单笔损失。当亏损达到设定百分比时,策略会止损离场。该设定可避免单笔大额损失。日损失限制用于限制当日总体亏损。当净值损失超过3%时,策略会平仓止损,不再开新仓以防止进一步损失。
优势分析
该策略结合RSI指标与止损/日损失限制,具有如下优势:
- 使用RSI判断超买超卖具有一定的可靠性,可以过滤掉部分噪音交易机会
- 止损机制有效控制单笔亏损风险
- 日损失限制避免极端行情下的巨额亏损
- 策略规则清晰简单,容易理解与实施
- 可自定义RSI参数与止损点位适应不同市场环境
风险分析
该策略也存在一些风险:
- RSI指标作为技术分析工具,无法完全预测价格变化趋势与时间点
- 止损点设定不当可能过早止损或止损幅度过大
- 日损失限制会过早结束当日交易,错过后续交易机会
- 参数设定(如RSI长度、超买超卖阈值等)不当会影响策略效果
- 数据回测不充分可能高估策略实际收益
优化方向
该策略可从以下几个方面进行优化:
- 测试不同市场及不同周期下RSI参数与超买超卖阈值的最优组合
- 根据历史数据计算出最优止损百分比
- 评估不同日损失限制水平的风险收益效果
- 在多支股票上测试,设计股票池算法提高stable性
- 结合其他指标如MACD、KD等设计动态止损、动态位置大小
- 增加机器学习算法提升策略收益
总结
该相对强度指数止损策略整合了技术指标与风险控制机制的优点,在一定程度上过滤噪音交易机会、控制交易风险。策略简单清晰,易于实践,可作为量化交易的入门策略之一。但其参数设置与止损机制可进一步优化,且面临一定概率获利的不确定性。整体而言,该策略为初学者提供了一个参考模板,但实际运用中需要谨慎评估与调整。
策略源码
//@version=5
strategy("RSI Strategy with Daily Loss Limit", overlay=true)

// Define RSI conditions
rsiValue = ta.rsi(close, 7)
rsiLength = input(15, title="RSI Length")
rsiOverbought = 75
rsiOversold = 37

// Define stop-loss percentage
stopLossPercent = input(1, title="Stop Loss Percentage") / 100

// Enter long (buy) when RSI is below 40 with stop-loss
if (rsiValue < rsiOversold)
    strategy.entry("Buy", strategy.long)

// Exit long when RSI is above 80 or when stop-loss is hit
if (rsiValue > rsiOverbought)
    strategy.exit("Buy", from_entry="Buy", loss=close * stopLossPercent)

// Enter short (sell) when RSI is above 80 with stop-loss
if (rsiValue > rsiOverbought)
    strategy.entry("Sell", strategy.short)

// Exit short when RSI is below 40 or when stop-loss is hit
if (rsiValue < rsiOversold)
    strategy.exit("Sell", from_entry="Sell", loss=close * stopLossPercent)

// Track account equity
equityLimit = strategy.equity * 0.97  // Set the daily loss limit to 3%

// Enter long (buy) when RSI is below 40
if (rsiValue < rsiOversold)
    strategy.entry("Buy", strategy.long)

// Exit long when RSI is above 80 or when stop-loss is hit
if (rsiValue > rsiOverbought)
    strategy.exit("Buy", from_entry="Buy", loss=close * stopLossPercent)

// Enter short (sell) when RSI is above 80
if (rsiValue > rsiOverbought)
    strategy.entry("Sell", strategy.short)

// Exit short when RSI is below 40 or when stop-loss is hit
if (rsiValue < rsiOversold)
    strategy.exit("Sell", from_entry="Sell", loss=close * stopLossPercent)

// Plot RSI on the chart
plot(rsiValue, title="RSI", color=color.blue)

// Stop trading for the day if the daily loss limit is reached
if (strategy.equity < equityLimit)
    strategy.close_all()