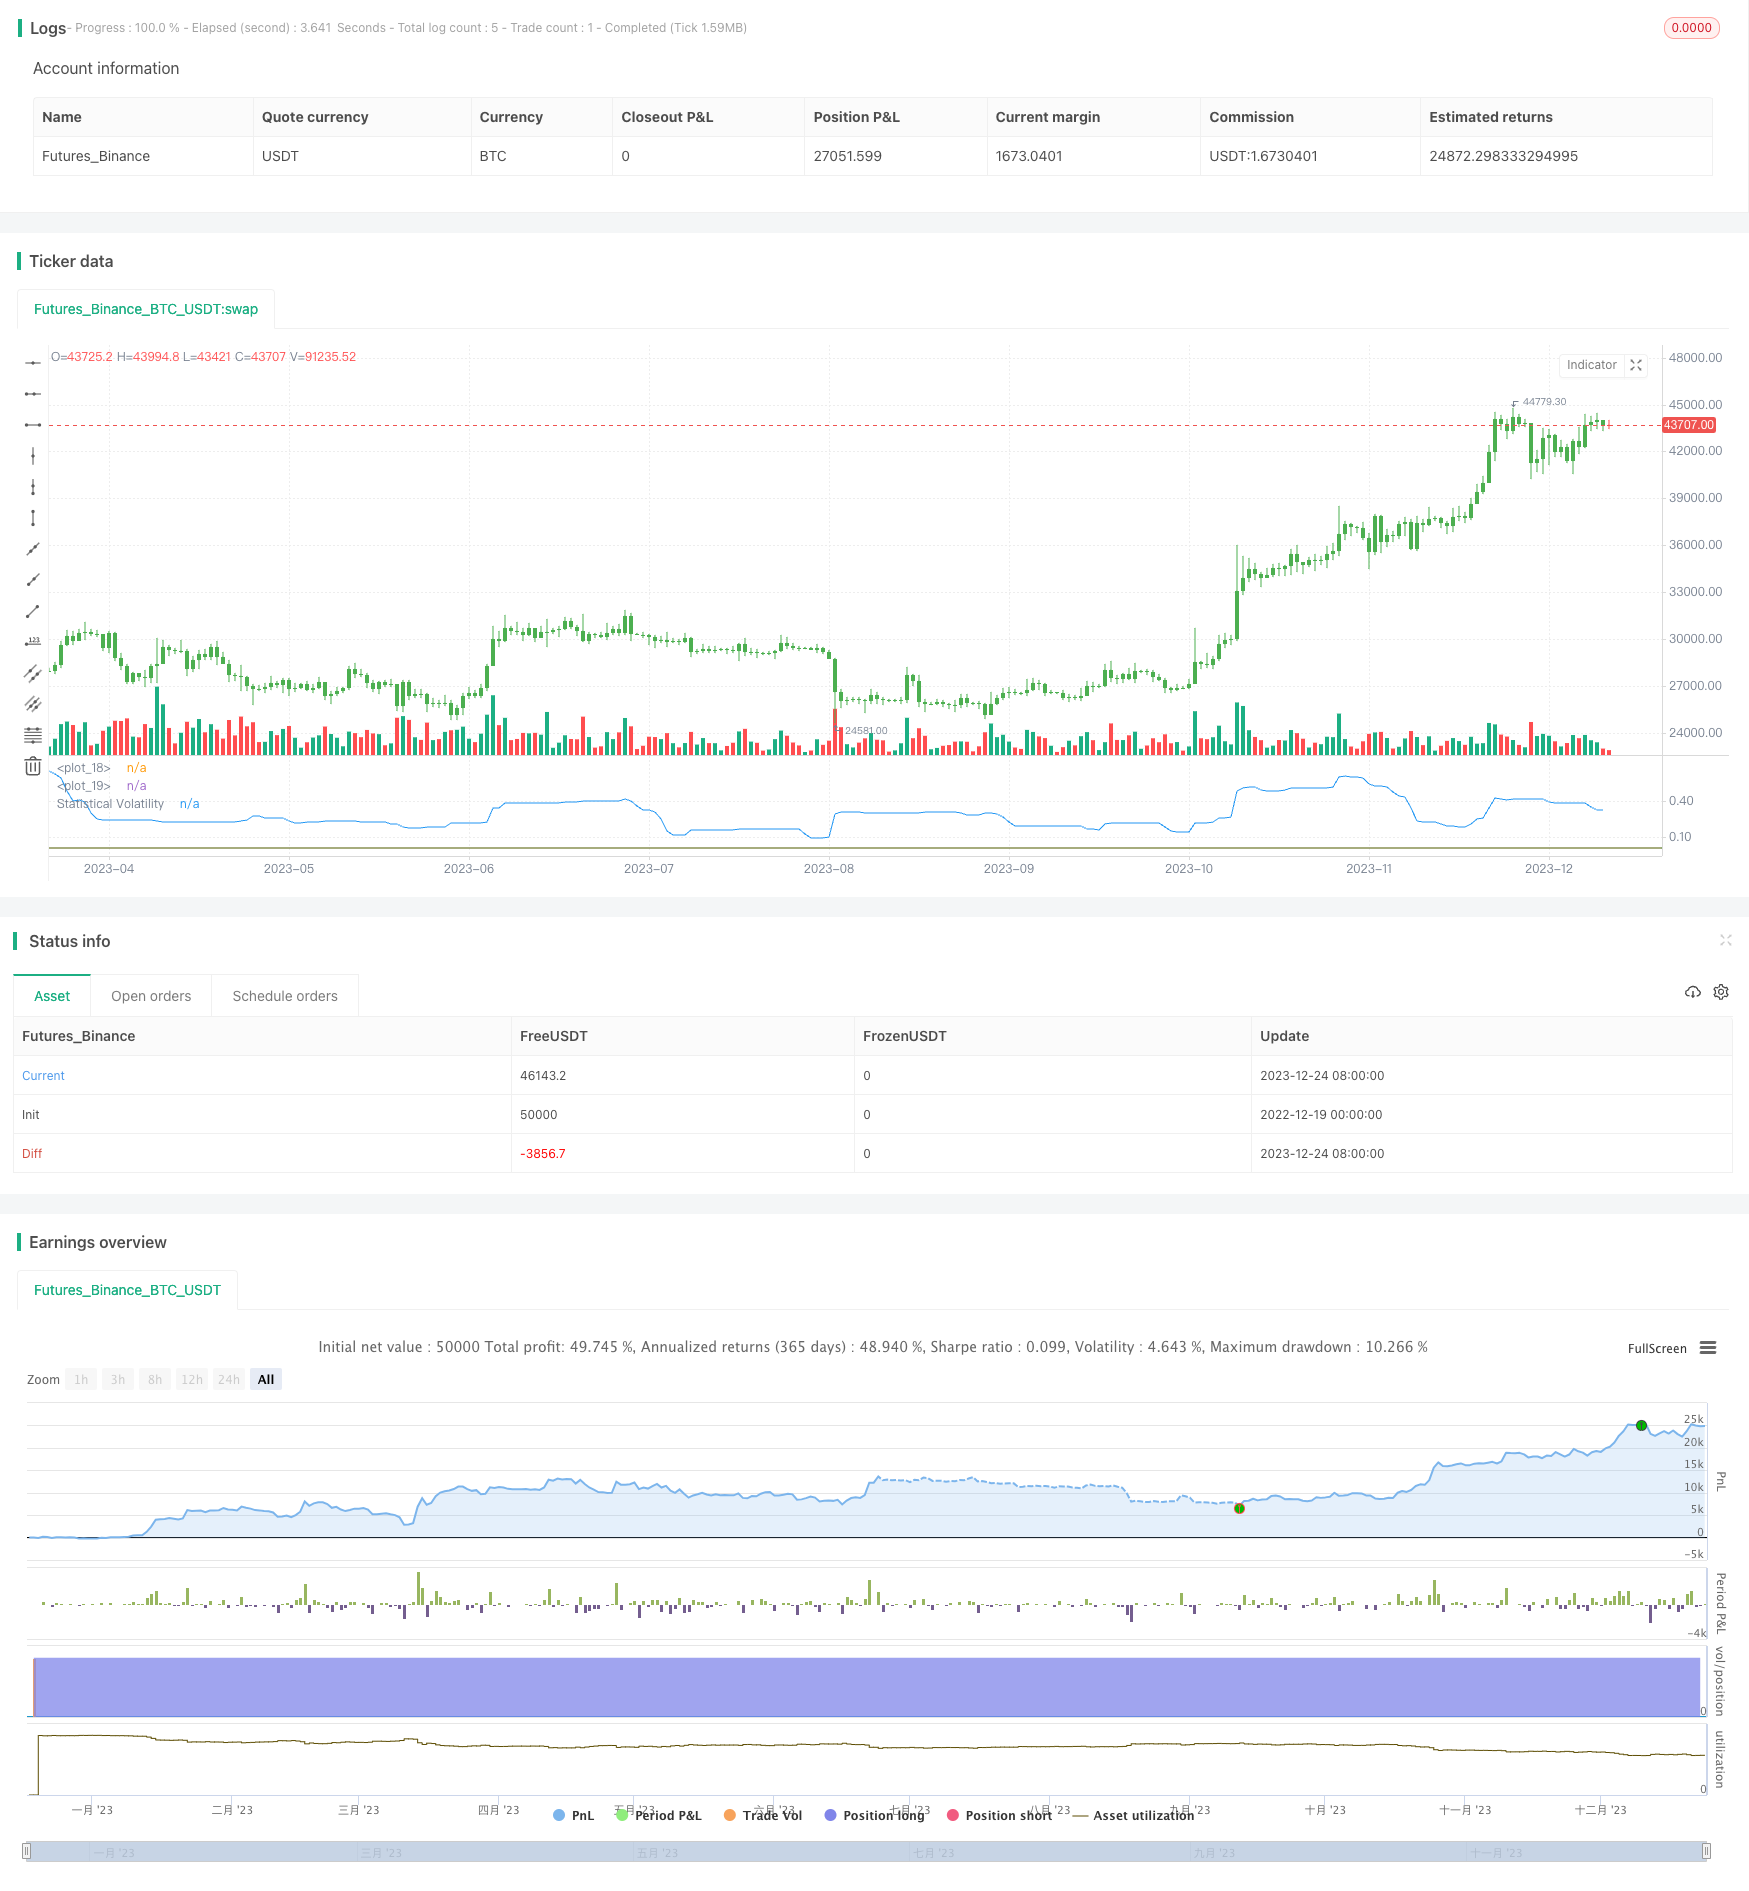
概述
本策略利用极值法计算统计波动率,也称为历史波动率。它基于最高价、最低价、收盘价的极值,结合时间因素,测算出统计波动率。该波动率反映了资产价格的波动性。策略会在波动率高于或低于设定的阈值时,做出相应的多头或空头交易。
策略原理
- 计算一定时间周期内的最高价、最低价、收盘价的极值
- 应用极值法公式,计算出统计波动率
SqrTime = sqrt(253 / Length) Vol = ((0.6 * log(xMaxC / xMinC) * SqrTime) + (0.6 * log(xMaxH / xMinL) * SqrTime)) * 0.5 - 比较波动率与设定的上下阈值,产生交易信号
pos = iff(nRes > TopBand, 1, iff(nRes < LowBand, -1, nz(pos[1], 0))) - 根据交易信号做多或做空
优势分析
本策略主要优势有:
- 使用统计波动率指标,可以有效捕捉市场的热点与反转机会
- 极值法计算波动率,对极端价格不敏感,结果更稳定可靠
- 可以通过调整参数,适应不同波动率环境的交易
风险分析
本策略主要存在以下风险:
- 统计波动率本身存在一定滞后性,不能准确把握市场转折点
- 波动率指标对突发事件反应较慢,可能错过短期交易机会
- 存在一定的错交易风险与止损风险
对策与解决方法:
- 适当缩短统计周期,提高对市场变化的敏感性
- 结合其它指标作为辅助,提高信号的准确性
- 设置止损点,控制单笔损失
优化方向
本策略的优化方向:
- 测试不同的统计周期参数,找出最优参数
- 增加仓位管理模块,根据波动率调整仓位
- 结合移动平均线等指标,设定过滤条件,减少误交易
总结
本策略利用极值法计算统计波动率,通过捕捉波动率异动产生交易信号。相比简单移动平均线等指标,它更能反映市场波动性,捕捉反转。同时,极值法算法也使得结果更稳定可靠。通过参数调整与优化,本策略可以适应不同市况,其交易思路与统计波动率指标值得进一步研究与应用。
策略源码
/*backtest
start: 2022-12-19 00:00:00
end: 2023-12-25 00:00:00
period: 1d
basePeriod: 1h
exchanges: [{"eid":"Futures_Binance","currency":"BTC_USDT"}]
*/

//@version=2
////////////////////////////////////////////////////////////
//  Copyright by HPotter v1.0 22/11/2014
// This indicator used to calculate the statistical volatility, sometime
// called historical volatility, based on the Extreme Value Method.
// Please use this link to get more information about Volatility.
//
// You can change long to short in the Input Settings
// WARNING:
// - For purpose educate only
// - This script to change bars colors.
////////////////////////////////////////////////////////////
strategy(title="Statistical Volatility - Extreme Value Method ", shorttitle="Statistical Volatility Backtest")
Length = input(30, minval=1)
TopBand = input(0.005, step=0.001)
LowBand = input(0.0016, step=0.001)
reverse = input(false, title="Trade reverse")
hline(TopBand, color=red, linestyle=line)
hline(LowBand, color=green, linestyle=line)
xMaxC = highest(close, Length)
xMaxH = highest(high, Length)
xMinC = lowest(close, Length)
xMinL = lowest(low, Length)
SqrTime = sqrt(253 / Length)
Vol = ((0.6 * log(xMaxC / xMinC) * SqrTime) + (0.6 * log(xMaxH / xMinL) * SqrTime)) * 0.5
nRes = iff(Vol < 0,  0, iff(Vol > 2.99, 2.99, Vol))
pos = iff(nRes > TopBand, 1,
	   iff(nRes < LowBand, -1, nz(pos[1], 0)))
possig = iff(reverse and pos == 1, -1,
          iff(reverse and pos == -1, 1, pos))
if (possig == 1)
    strategy.entry("Long", strategy.long)
if (possig == -1)
    strategy.entry("Short", strategy.short)
barcolor(possig == -1 ? red: possig == 1 ? green : blue )
plot(nRes, color=blue, title="Statistical Volatility")