概述
趋势跟踪突破策略是一个基于移动平均线和布林带指标的趋势跟踪策略。该策略结合趋势分析和突破交易的思想,在确定市场趋势的同时,寻找具有突破潜力的机会。
策略原理
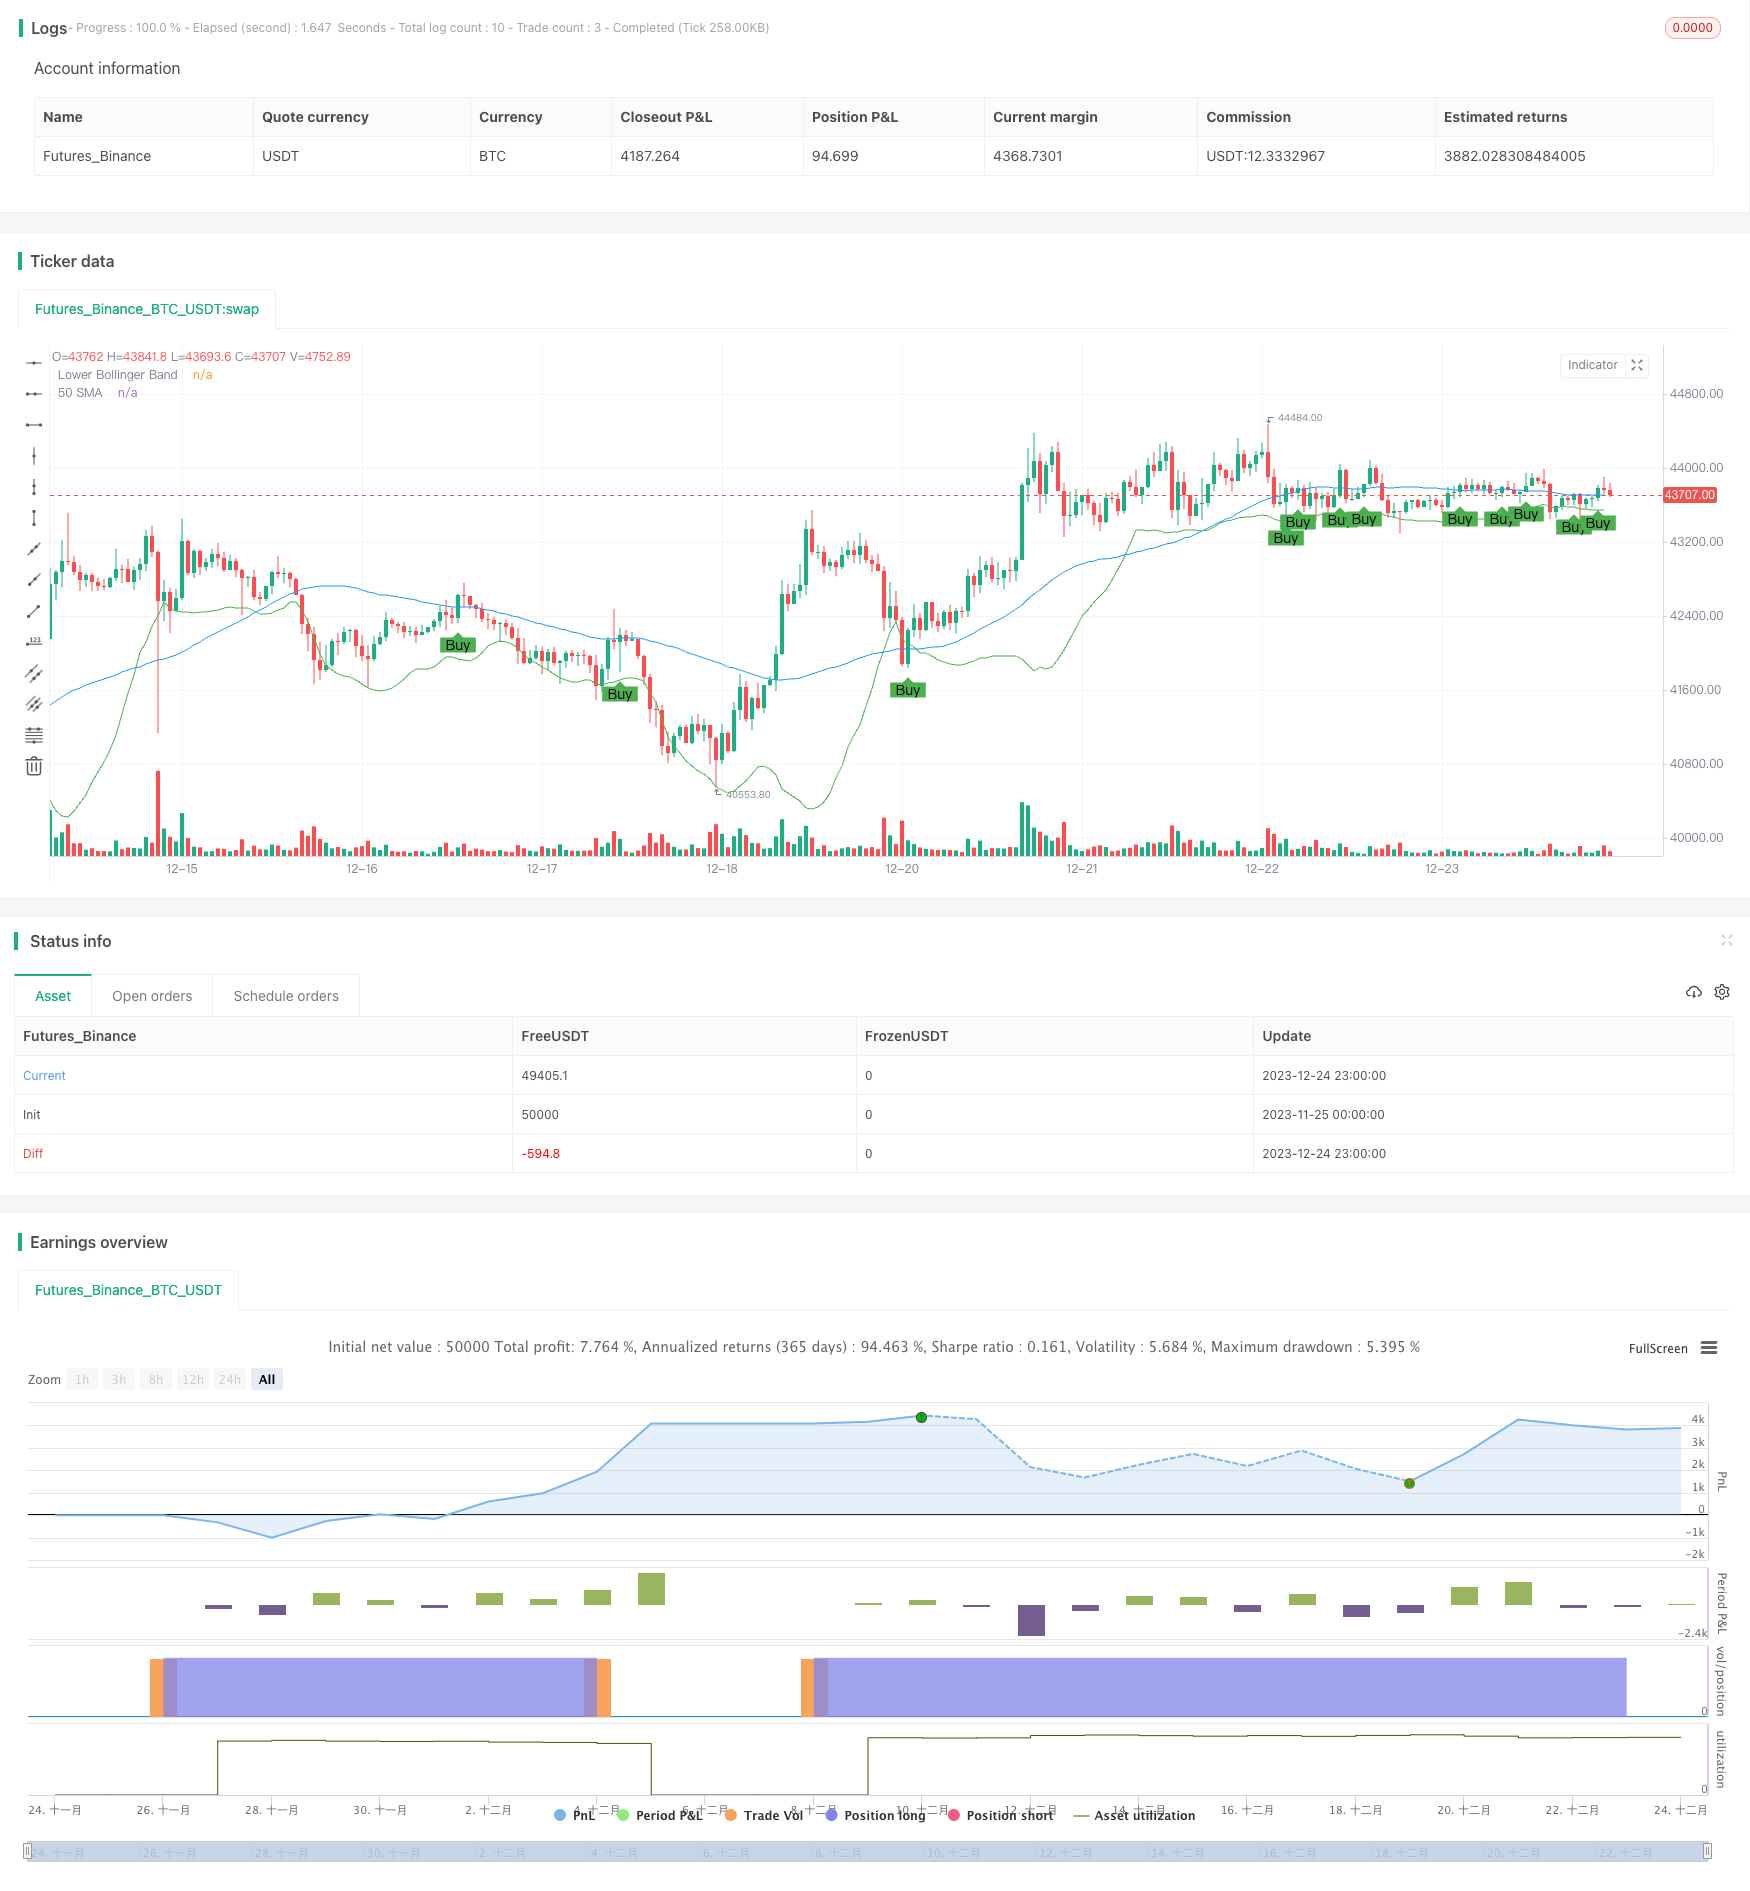
该策略使用50周期简单移动平均线判断趋势方向。当收盘价格上穿50日线时,考虑做多。同时,要求收盘价格高于下轨布林带,并且当前K线的最低价接近布林带下轨,表明价格在支撑位置附近,可能形成突破。
入场信号形成后,如果第二根K线的开盘价高于前一日最高价加1点的止损位置,则真正入场做多。
止损位置预先设置为入场那根K线最低价减5.7点。止盈位置设置为入场收盘价加11.4点,实现2倍的风险回报比。
策略优势分析
该策略结合趋势判断和关键支撑附近形成的突破,可以有效过滤假突破,提高交易胜率。止损和止盈根据风险回报比原则设置,有利于风险控制。
相对简单的指标和判断条件,使策略容易理解和实现,适合量化交易初学者学习。
策略风险分析
该策略主要依赖移动平均线判断趋势方向,当趋势变化时,可能产生错误信号。布林带参数设置不当也可能导致错误突破。
止损位置过于接近可能被秒出,止盈位置过大也可能限制盈利。这些参数的设置需要根据不同市场调整。
该策略仅考虑日内最高价和最低价,无法对隔夜跳空作出反应。
策略优化方向
可以考虑结合其他指标判断趋势,如MACD。或者使用自适应移动平均线追踪趋势变化。
布林带参数可以进行优化,寻找最佳参数组合。止损止盈位置也可以根据回测结果优化。
可以增加对隔夜跳空的判断逻辑,避免跳空后的亏损扩大。
总结
该策略整合趋势判断和突破交易的思路,使用简单指标形成过滤效果。策略优势在于易于理解和实现,通过参数优化可以获得较好的效果。但也存在一定的市场风险,需要根据实盘结果不断完善。
策略源码
/*backtest
start: 2023-11-25 00:00:00
end: 2023-12-25 00:00:00
period: 1h
basePeriod: 15m
exchanges: [{"eid":"Futures_Binance","currency":"BTC_USDT"}]
*/

//@version=4
strategy("Custom Strategy", overlay=true)

// Input variables
smaLength = 50
bbLength = 20
supportPercentage = 1
riskRewardRatio = 2

// Calculate indicators
sma = sma(close, smaLength)
bb_lower = sma(close, bbLength) - 2 * stdev(close, bbLength)

// Entry conditions based on provided details
enterLongCondition = crossover(close, sma) and close > bb_lower and low <= (bb_lower * (1 + supportPercentage / 100))

// Entry and exit logic
if (enterLongCondition)
    strategy.entry("Long", strategy.long)

// Assuming the details provided are for the daily timeframe
stopLossPrice = low - 5.70
takeProfitPrice = close + 11.40

strategy.exit("Take Profit/Stop Loss", from_entry="Long", loss=stopLossPrice, profit=takeProfitPrice)

// Plotting
plot(sma, color=color.blue, title="50 SMA")
plot(bb_lower, color=color.green, title="Lower Bollinger Band")

// Plot entry points on the chart
plotshape(series=enterLongCondition, title="Buy Signal", location=location.belowbar, color=color.green, style=shape.labelup, text="Buy")