概述
本策略基于四条不同周期的EMA均线比较,实现趋势跟踪交易。当快速EMA线上穿中速EMA线,中速EMA线上穿慢速EMA线,慢速EMA线上穿最慢速EMA线时,做多;当快速EMA线下穿中速EMA线,中速EMA线下穿慢速EMA线,慢速EMA线下穿最慢速EMA线时,做空。该策略同时结合了日期过滤条件,只在指定的日期区间内交易。
策略原理
该策略的核心逻辑基于四条EMA均线的比较。EMA均线可以有效平滑价格数据,滤除市场噪音,突出主要趋势。快速EMA线能最快反映价格变化,中速EMA稍微滞后,慢速EMA线再稍微滞后,最慢EMA线滞后效应最大。当快速EMA线上穿中速线,中速EMA线上穿慢速线,慢速EMA线上穿最慢速线时,说明目前处于强势上涨趋势,这时策略会开仓做多;反之,当快速EMA线下穿中速线,中速EMA线下穿慢速线,慢速EMA线下穿最慢速线时,说明目前处于强势下跌趋势,这时策略会开仓做空。
该策略还结合了日期条件过滤,只在指定的日期区间内交易,可以避免特定时间段的异常波动对策略的影响。
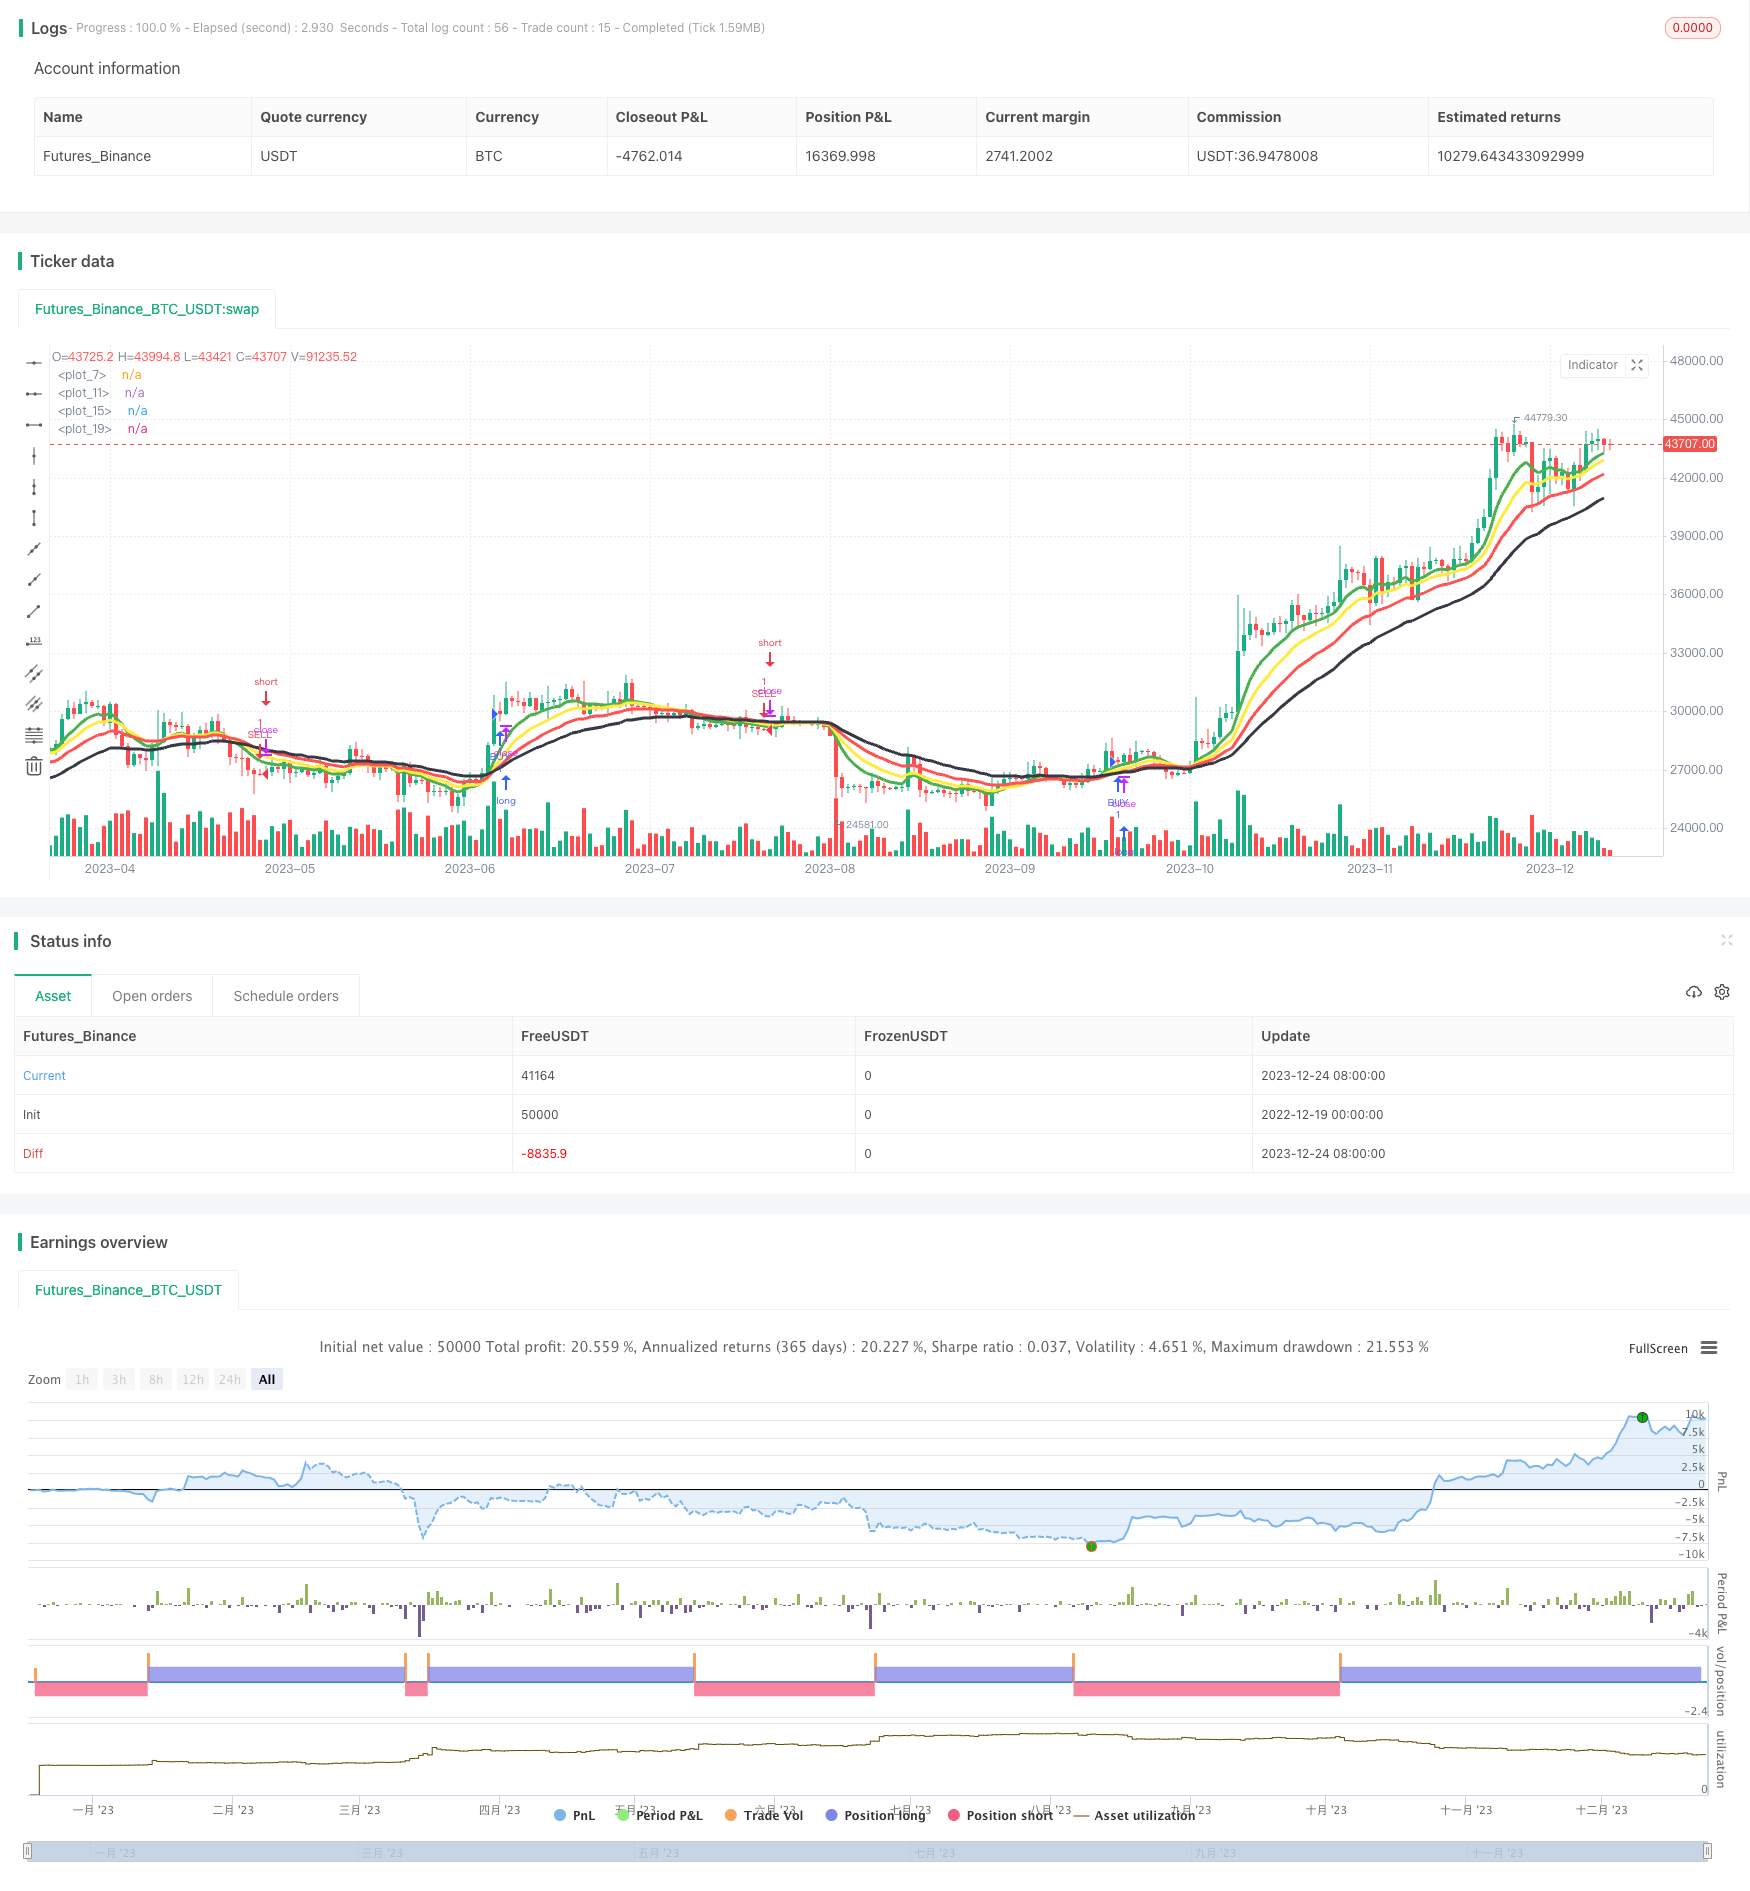
具体来说,策略中的四条EMA均线周期分别为8日、13日、21日和34日。这四条均线的周期都比较短,主要用来捕捉短期和中期趋势。策略指定的日期区间为2018年6月1日至2019年12月31日。只有价格数据在这个时间段里,且满足四EMA的比较关系时,策略才会发出交易信号。
优势分析
这种四EMA趋势策略有以下几个优势:
- 使用多组EMA均线识别趋势,精确度较高,可有效跟踪市场趋势;
- 均线周期较短,可以快速响应价格变化,捕捉短期和中期走势;
- 结合日期条件过滤,可以避开异常行情的影响,提高策略稳定性;
- 策略逻辑简单清晰,容易理解和回测;
- 可灵活调整EMA均线的周期参数,适应不同品种和周期的行情特征。
风险分析
该策略也存在一些风险需要注意:
- EMA均线本身存在滞后性,可能错过短期的反转机会;
- SPECIFIED日期区间如果设定不当,可能导致样本数量太少,回测结果不稳定;
- 策略仅基于均线关系建立逻辑,没有结合其他因素,可能发生假信号;
- 策略没有设置止损条件,存在较大的资金风险。
为了降低上述风险,我们可以从以下几个方面进行优化:
- 结合其他指标如MACD、KD等判断趋势信号,避免假信号的产生;
- 加入适当的止损机制,控制每单和总体的风险;
- 测试更多品种和周期的数据,调整EMA参数,使之更符合不同市场环境。
优化方向
该策略主要可以从以下几个方面进行优化:
参数优化:调整EMA均线的长度参数,适应不同周期和不同品种,使策略对趋势的判断更准确。
止损机制:设置合理的止损点,比如ATR止损或趋势止损,控制单笔和总体的风险。
过滤条件:加入其他辅助指标,避免在没有明确趋势时发出错误信号。例如结合RSI、MACD等指标作为过滤信号。
止盈退出:设定合理的止盈位置或策略,在 tren保证一定盈利后退出市场。这可以锁定利润,避免利润回吐。
算法交易:将策略参数化,并接入算法交易系统,实现自动化交易,expand策略的适用范围。
总结
本策略基于四条EMA均线之间的比较关系判断趋势方向,属于简单实用型的趋势跟踪策略。它响应迅速,可有效跟踪短期和中期趋势,回测效果较好。我们可以通过调整参数,加入辅助过滤条件,以及设置止损止盈来降低风险和提高效率。此外,参数化和算法化也是本策略的重要优化方向,可以大幅提升策略的适用面。总的来说,四EMA均线策略是一个非常实用的量化交易策略,具有较强的普适性,值得量化交易者重点学习和优化。
/*backtest
start: 2022-12-19 00:00:00
end: 2023-12-25 00:00:00
period: 1d
basePeriod: 1h
exchanges: [{"eid":"Futures_Binance","currency":"BTC_USDT"}]
*/

//@version=3
strategy("4 EMA TREND Strategy ", overlay=true)


length1 = input(8, minval=1)
outFAST = ema(close,length1)
plot(outFAST, color=green ,linewidth=3)

length2 = input(13, minval=1)
outM = ema(close, length2)
plot(outM, color=yellow,linewidth=3)

length3 = input(21, minval=1)
outSLOW = ema(close, length3)
plot(outSLOW, color=red,linewidth=3)

length4 = input(34, minval=1)
outSLOWEST = ema(close, length4)
plot(outSLOWEST, color=black,linewidth=3)

price = close


yearfrom = input(2018)
yearuntil =input(2019)
monthfrom =input(6)
monthuntil =input(12)
dayfrom=input(1)
dayuntil=input(31)


if (  (outFAST>outM) and (outM > outSLOW) and(outSLOW>outSLOWEST))
    strategy.entry("BUY", strategy.long, stop=close, oca_name="TREND", comment="BUY")

else
    strategy.cancel(id="BUY")


if   (  (outFAST<outM) and (outM<outSLOW) and (outSLOW <outSLOWEST))

    strategy.entry("SELL", strategy.short,stop=close, oca_name="TREND", comment="SELL")
else
    strategy.cancel(id="SELL")