概述
本策略通过自定义时间周期的买卖量进行多空判断,结合周线VWAP、布林带进行过滤,实现高概率的趋势追踪。同时引入动态止盈止损机制,能有效控制单边风险。
策略原理
- 计算自定义时间周期内的买卖量指标
- BV:买量,通过低点买入造成的量
- SV:卖量,通过高点卖出造成的量
- 对买卖量进行处理
- 利用20周期EMA进行平滑
- 对处理后的买卖量进行正负分离
- 判断指标方向
- 指标大于0为看涨,小于0为看跌
- 结合周线VWAP、布林带判断背离
- 价格在VWAP之上且指标看涨为做多信号
- 价格在VWAP之下且指标看跌为做空信号
- 动态止盈止损
- 按日ATR设置止盈止损百分比
策略优势
- 买卖量能反映市场真实动力,捕捉趋势潜在能量
- 周线VWAP判断大周期趋势方向,布林带判断突破信号
- 动态ATR设置止盈止损,能最大限度锁定利润,避免超调
策略风险
- 买卖量数据存在一定误差,可能导致判断失误
- 单一指标结合判断,容易产生误信号
- 布林带 Parameter设置不当,会缩小有效突破
策略优化方向
- 多时间周期买卖量指标进行优化
- 增加交易量等辅助指标进行过滤
- 动态调整布林带 Parameter,提高突破效率
总结
本策略充分利用买卖量的预测性,辅以VWAP和布林带产生高概率信号,通过动态止盈止损有效控制风险,是一种高效稳定的量化交易策略。随着参数及规则的不断优化,预计效果会更加明显。
策略源码
/*backtest
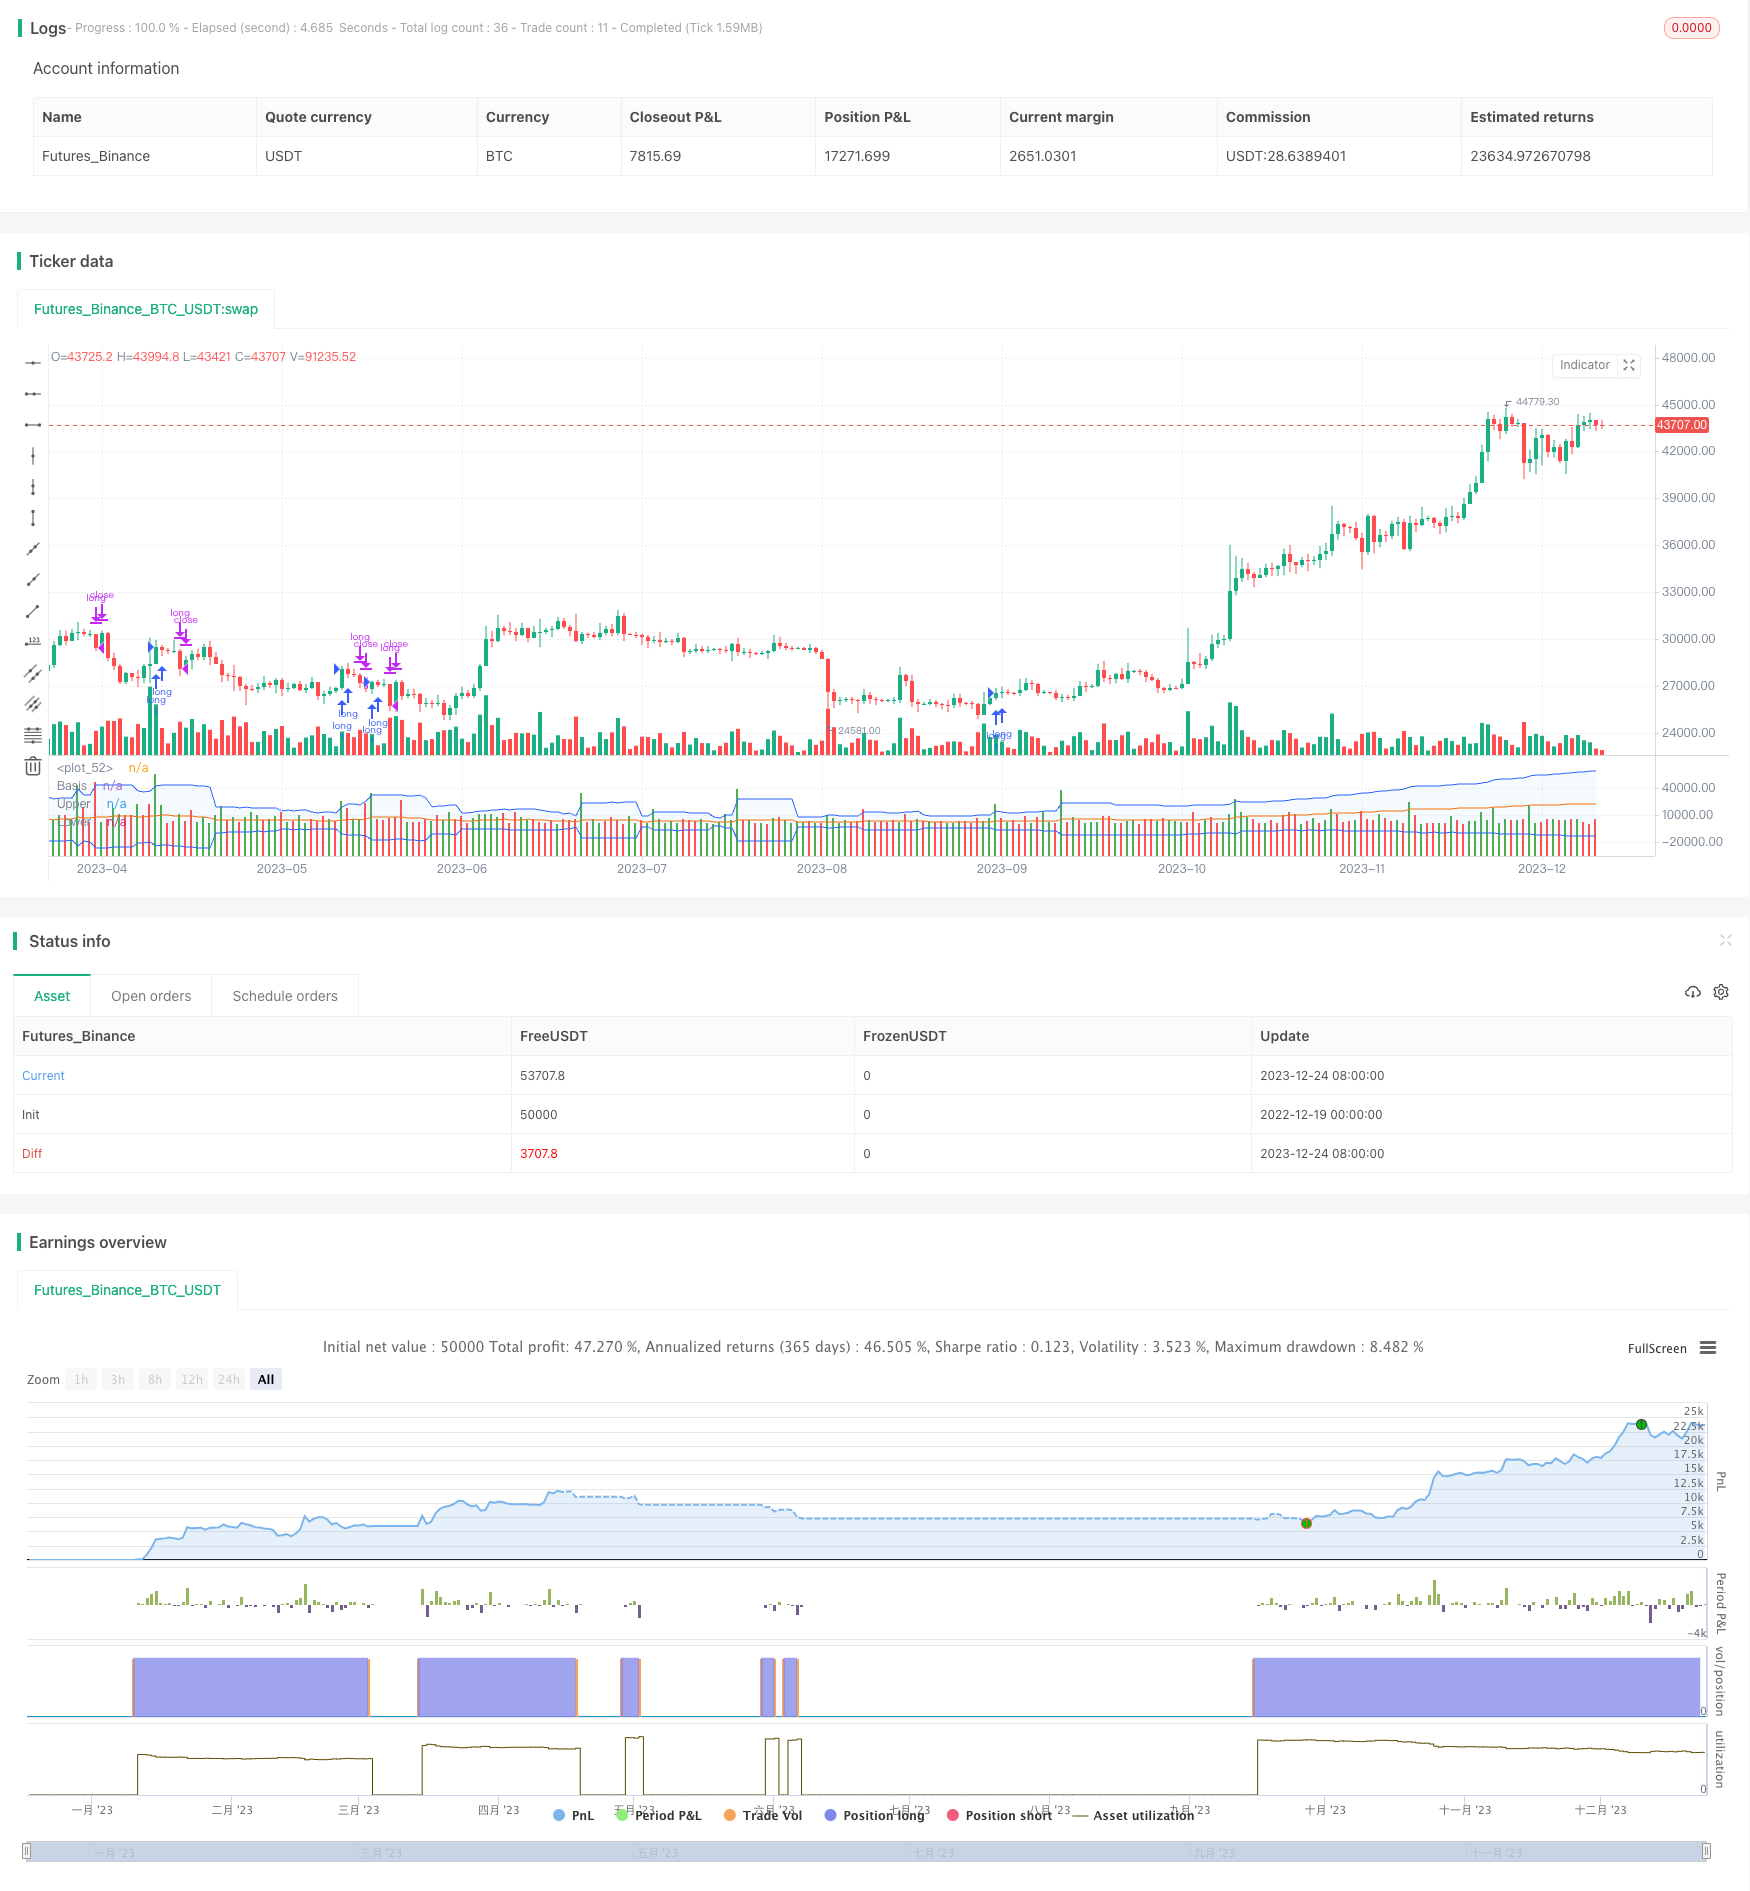
start: 2022-12-19 00:00:00
end: 2023-12-25 00:00:00
period: 1d
basePeriod: 1h
exchanges: [{"eid":"Futures_Binance","currency":"BTC_USDT"}]
*/
// This source code is subject to the terms of the Mozilla Public License 2.0 at https://mozilla.org/MPL/2.0/
// © original author ceyhun
//@ exlux99 update
//@version=5
strategy('Buying Selling Volume Strategy', format=format.volume, precision=0, overlay=false)
weekly_vwap = request.security(syminfo.tickerid, "W", ta.vwap(hlc3))
vi = false
customTimeframe = input.timeframe("60", group="Entry Settings")
allow_long = input.bool(true, group="Entry Settings")
allow_short = input.bool(false, group="Entry Settings")
xVolume = request.security(syminfo.tickerid, customTimeframe, volume)
xHigh = request.security(syminfo.tickerid, customTimeframe, high)
xLow = request.security(syminfo.tickerid, customTimeframe, low)
xClose = request.security(syminfo.tickerid, customTimeframe, close)
BV = xHigh == xLow ? 0 : xVolume * (xClose - xLow) / (xHigh - xLow)
SV = xHigh == xLow ? 0 : xVolume * (xHigh - xClose) / (xHigh - xLow)
vol = xVolume > 0 ? xVolume : 1
TP = BV + SV
BPV = BV / TP * vol
SPV = SV / TP * vol
TPV = BPV + SPV
tavol20 = request.security(syminfo.tickerid, customTimeframe, ta.ema(vol, 20))
tabv20= request.security(syminfo.tickerid, customTimeframe, ta.ema(BV, 20))
tasv20= request.security(syminfo.tickerid, customTimeframe, ta.ema(SV, 20))
VN = vol / tavol20
BPN = BV / tabv20 * VN * 100
SPN = SV / tasv20 * VN * 100
TPN = BPN + SPN
xbvp = request.security(syminfo.tickerid, customTimeframe,-math.abs(BPV))
xbpn = request.security(syminfo.tickerid, customTimeframe,-math.abs(BPN))
xspv = request.security(syminfo.tickerid, customTimeframe,-math.abs(SPV))
xspn = request.security(syminfo.tickerid, customTimeframe,-math.abs(SPN))
BPc1 = BPV > SPV ? BPV : xbvp
BPc2 = BPN > SPN ? BPN : xbpn
SPc1 = SPV > BPV ? SPV : xspv
SPc2 = SPN > BPN ? SPN : xspn
BPcon = vi ? BPc2 : BPc1
SPcon = vi ? SPc2 : SPc1
minus = BPcon + SPcon
plot(minus, color = BPcon > SPcon ? color.green : color.red , style=plot.style_columns)
length = input.int(20, minval=1, group="Volatility Settings")
src = minus//input(close, title="Source")
mult = input.float(2.0, minval=0.001, maxval=50, title="StdDev", group="Volatility Settings")
xtasma = request.security(syminfo.tickerid, customTimeframe, ta.sma(src, length))
xstdev = request.security(syminfo.tickerid, customTimeframe, ta.stdev(src, length))
basis = xtasma
dev = mult * xstdev
upper = basis + dev
lower = basis - dev
plot(basis, "Basis", color=#FF6D00, offset = 0)
p1 = plot(upper, "Upper", color=#2962FF, offset = 0)
p2 = plot(lower, "Lower", color=#2962FF, offset = 0)
fill(p1, p2, title = "Background", color=color.rgb(33, 150, 243, 95))
// Original a
longOriginal = minus > upper and BPcon > SPcon and close > weekly_vwap
shortOriginal = minus > upper and BPcon < SPcon and close< weekly_vwap
high_daily = request.security(syminfo.tickerid, "D", high)
low_daily = request.security(syminfo.tickerid, "D", low)
close_daily = request.security(syminfo.tickerid, "D", close)
true_range = math.max(high_daily - low_daily, math.abs(high_daily - close_daily[1]), math.abs(low_daily - close_daily[1]))
atr_range = ta.sma(true_range*100/request.security(syminfo.tickerid, "D", close), 14)
ProfitTarget_Percent_long = input.float(100.0, title='TP Multiplier for Long entries ', step=0.5, step=0.5, group='Dynamic Risk Management')
Profit_Ticks_long = close + (close * (atr_range * ProfitTarget_Percent_long))/100
LossTarget_Percent_long = input.float(1.0, title='SL Multiplier for Long entries', step=0.5, group='Dynamic Risk Management')
Loss_Ticks_long = close - (close * (atr_range * LossTarget_Percent_long ))/100
ProfitTarget_Percent_short = input.float(100.0, title='TP Multiplier for Short entries ', step=0.5, step=0.5, group='Dynamic Risk Management')
Profit_Ticks_short = close - (close * (atr_range*ProfitTarget_Percent_short))/100
LossTarget_Percent_short = input.float(5.0, title='SL Multiplier for Short entries', step=0.5, group='Dynamic Risk Management')
Loss_Ticks_short = close + (close * (atr_range*LossTarget_Percent_short))/100
var longOpened_original = false
var int timeOfBuyLong = na
var float tpLong_long_original = na
var float slLong_long_original = na
long_entryx = longOriginal
longEntry_original = long_entryx and not longOpened_original
if longEntry_original
longOpened_original := true
tpLong_long_original := Profit_Ticks_long
slLong_long_original := Loss_Ticks_long
timeOfBuyLong := time
//lowest_low_var_sl := lowest_low
tpLong_trigger = longOpened_original[1] and ((close > tpLong_long_original) or (high > tpLong_long_original)) //or high > lowest_low_var_tp
slLong_Trigger = longOpened_original[1] and ((close < slLong_long_original) or (low < slLong_long_original)) //or low < lowest_low_var_sl
longExitSignal_original = shortOriginal or tpLong_trigger or slLong_Trigger
if(longExitSignal_original)
longOpened_original := false
tpLong_long_original := na
slLong_long_original := na
if(allow_long)
strategy.entry("long", strategy.long, when=longOriginal)
strategy.close("long", when= longExitSignal_original) //or shortNew
if(allow_short)
strategy.entry("short", strategy.short, when=shortOriginal )
strategy.close("short", when= longOriginal) //or shortNew