概述
该策略通过计算最近一定时间段内的最高价和最低价,结合当前价格,形成一个动态的中轴线。然后根据最近的波动率生成红色下行通道和绿色上行通道。这三条通道线构成一个可交易范围。当价格接近通道边界时,做反向操作,目标是回到中轴线上获利。同时,策略内部包含一个趋势计算,用于过滤不顺趋势的交易,防止被大趋势捣毁。
策略原理
- 计算最近N周期内的最高价和最低价,结合当前收盘价形成动态中轴线
- 根据ATR和乘数生成动态通道带,带宽随市场波动率变化
- 当价格从下方通道线反弹时做多,从上方通道线反弹时做空
- 有止盈和止损逻辑,目标回到中轴线停利
- 同时计算趋势指数,用于过滤不顺势的交易
优势分析
- 通道线位置动态变化,能实时捕捉市场波动率
- 顺势交易概率较大,有利于把握趋势
- 有止损逻辑控制单笔损失
风险分析
- 参数优化不当可能导致过度交易
- 大趋势下无法完全滤除逆势交易
- 单边突破通道线可能继续运行
优化方向
- 调整通道线的参数,使其更符合不同品种的特点
- 调整趋势指数参数,提高顺势概率
- 增加机器学习元素,使参数动态优化
总结
该策略主要依赖市场的震荡特征获利。通过动态通道捕捉价格反转点,并结合趋势过滤,可以有效利用反转交易获利,同时控制风险。关键在与参数的调节,需要使通道线既能实时跟踪价格,又不会过于敏感。同时趋势指数也需要选取合适周期才能发挥过滤作用。该策略理论顺势且有止损,实际运用中通过参数优化可以获得不错回报。
策略源码
/*backtest
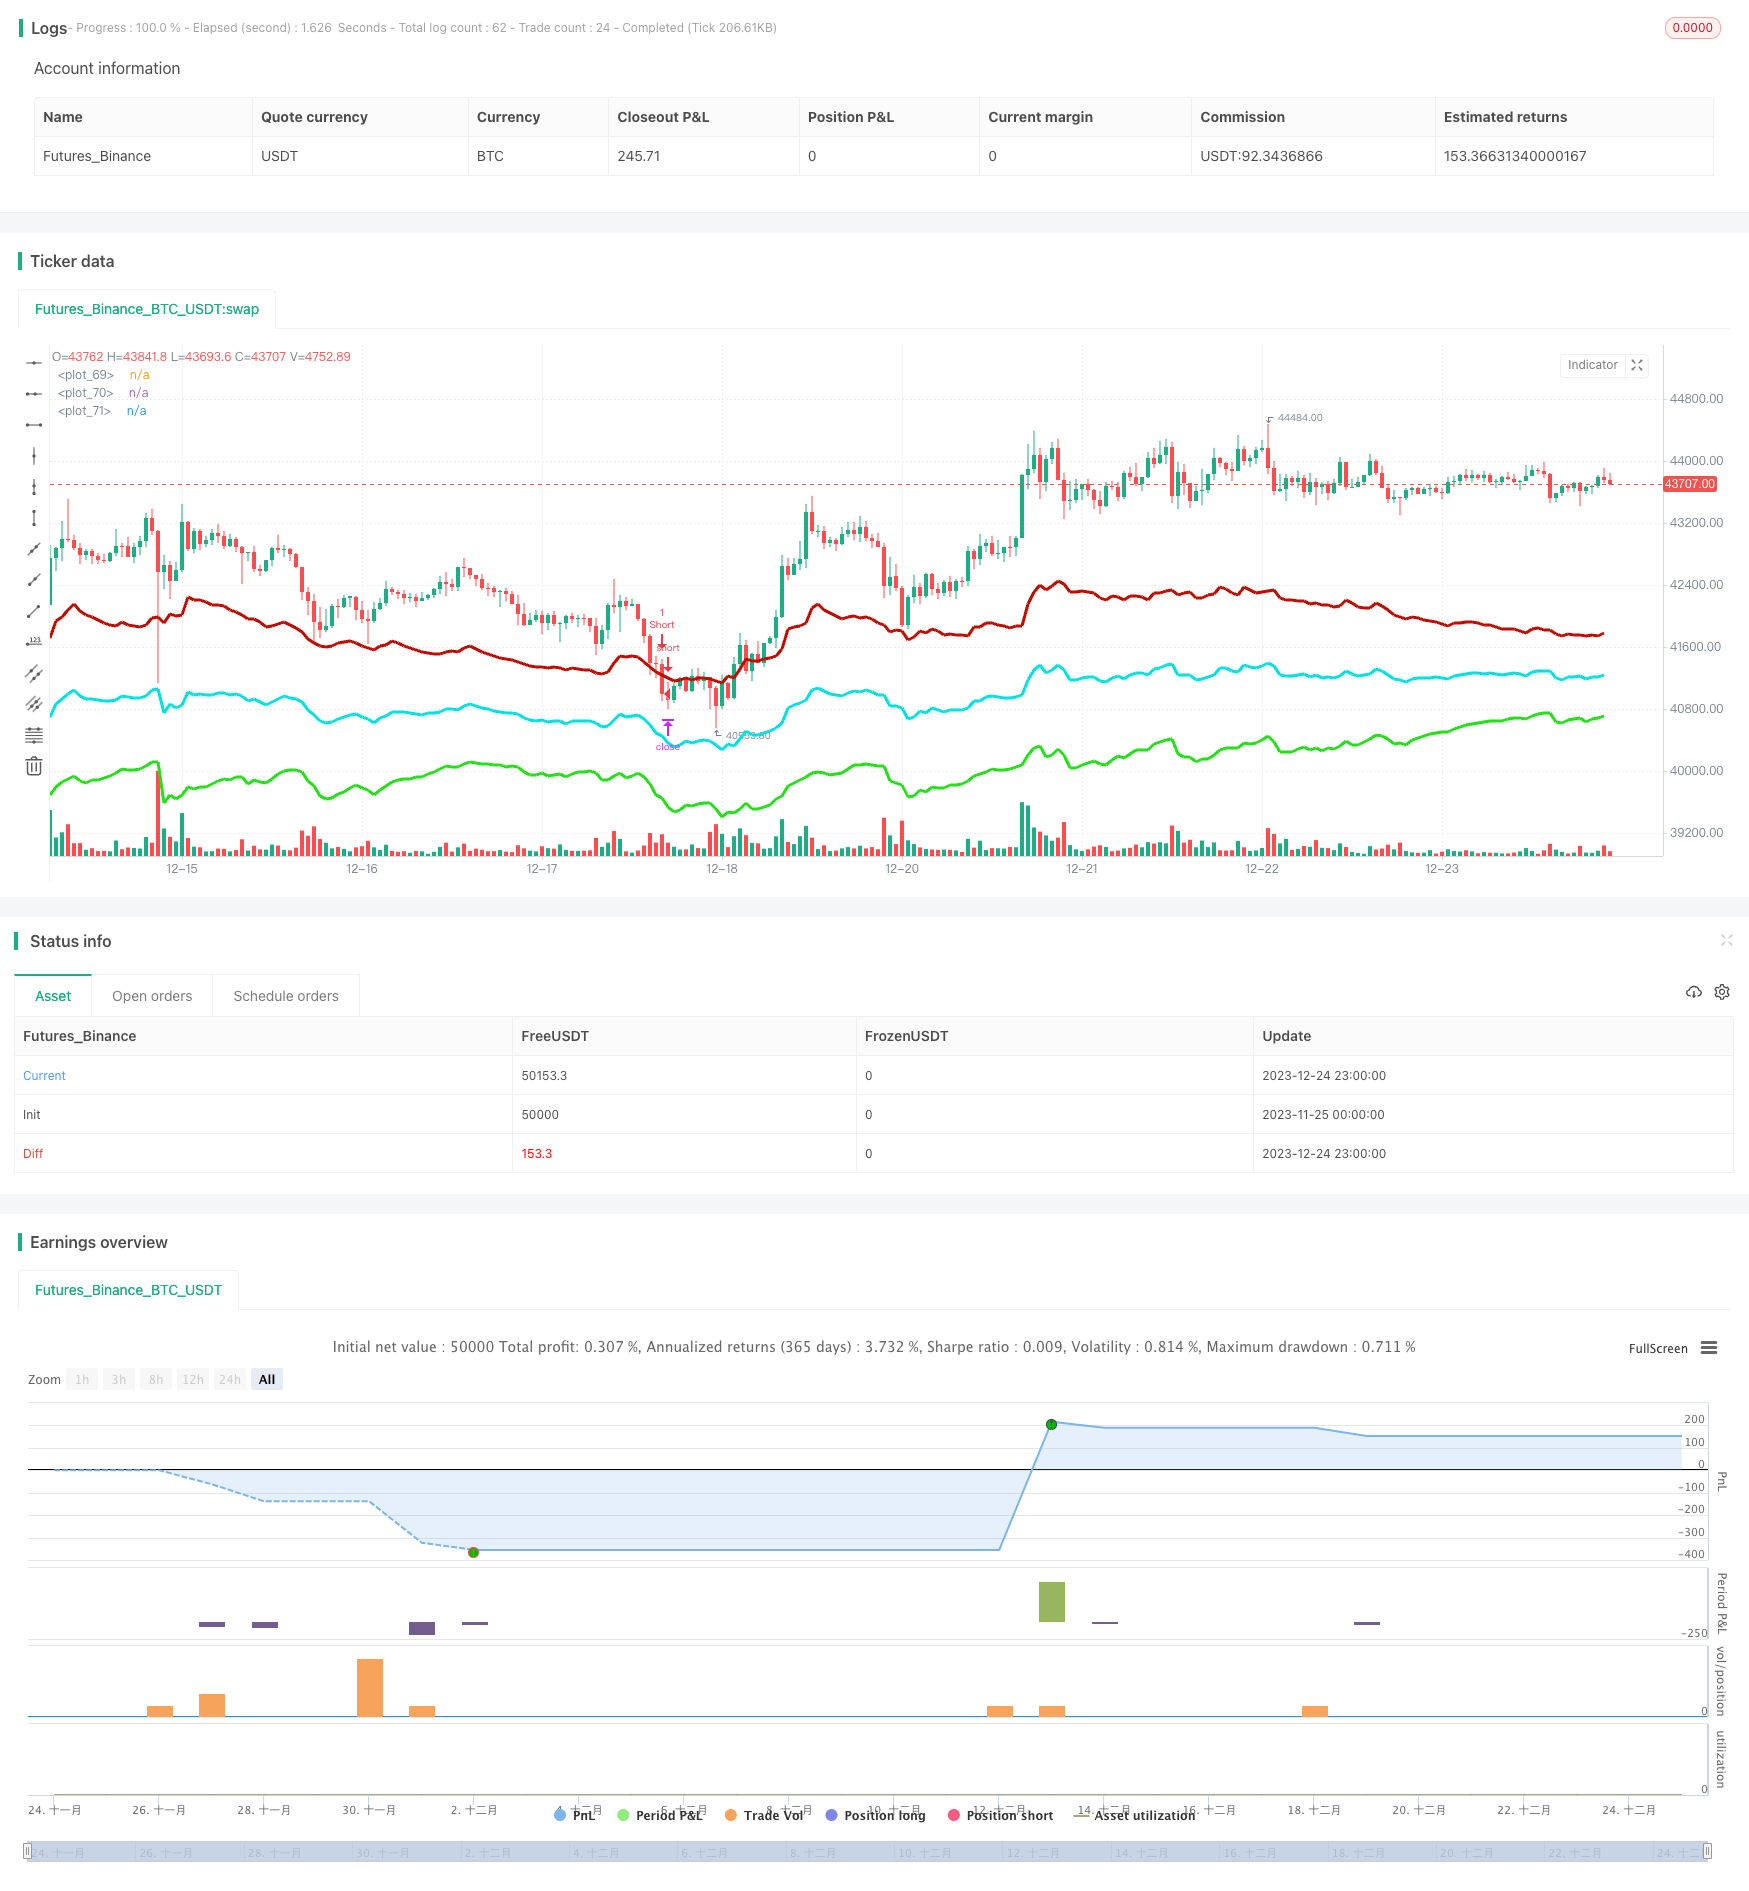
start: 2023-11-25 00:00:00
end: 2023-12-25 00:00:00
period: 1h
basePeriod: 15m
exchanges: [{"eid":"Futures_Binance","currency":"BTC_USDT"}]
*/
//@version=4
strategy(title="Strategy - Bobo PAPATR", overlay=true, default_qty_type = strategy.fixed, default_qty_value = 1, initial_capital = 10000)
// === STRATEGY RELATED INPUTS AND LOGIC ===
len = input(24, minval=1, title="Pivot Length, defines lookback for highs and lows to make pivots")
length = input(title="ATR lookback (Lower = bands more responsive to recent price action)", type=input.integer, defval=22)
myatr = atr(length)
dailyatr = myatr[1]
atrmult = input(title="ATR multiplier (Lower = wider bands)", type=input.float, defval=3)
pivot0 = (high[1] + low[1] + close[1]) / 3
// PIVOT CALC
h = highest(len)
h1 = dev(h, len) ? na : h
hpivot = fixnan(h1)
l = lowest(len)
l1 = dev(l, len) ? na : l
lpivot = fixnan(l1)
pivot = (lpivot + hpivot + pivot0) / 3
upperband1 = (dailyatr * atrmult) + pivot
lowerband1 = pivot - (dailyatr * atrmult)
middleband = pivot
// == TREND CALC ===
i1=input(2, "Momentum Period", minval=1) //Keep at 2 usually
i2=input(20, "Slow Period", minval=1)
i3=input(5, "Fast Period", minval=1)
i4=input(3, "Smoothing Period", minval=1)
i5=input(4, "Signal Period", minval=1)
i6=input(50, "Extreme Value", minval=1)
hiDif = high - high[1]
loDif = low[1] - low
uDM = hiDif > loDif and hiDif > 0 ? hiDif : 0
dDM = loDif > hiDif and loDif > 0 ? loDif : 0
ATR = rma(tr(true), i1)
DIu = 100 * rma(uDM, i1) / ATR
DId = 100 * rma(dDM, i1) / ATR
HLM2 = DIu - DId
DTI = (100 * ema(ema(ema(HLM2, i2), i3), i4)) / ema(ema(ema(abs(HLM2), i2), i3), i4)
signal = ema(DTI, i5)
// === RISK MANAGEMENT INPUTS ===
inpTakeProfit = input(defval = 0, title = "Take Profit (In Market MinTick Value)", minval = 0)
inpStopLoss = input(defval = 100, title = "Stop Loss (In Market MinTick Value)", minval = 0)
// === RISK MANAGEMENT VALUE PREP ===
// if an input is less than 1, assuming not wanted so we assign 'na' value to disable it.
useTakeProfit = inpTakeProfit >= 1 ? inpTakeProfit : na
useStopLoss = inpStopLoss >= 1 ? inpStopLoss : na
// === STRATEGY - LONG POSITION EXECUTION ===
enterLong = (((low<=lowerband1) and (close >lowerband1)) or ((open <= lowerband1) and (close > lowerband1))) and (strategy.opentrades <1) and (atr(3) > atr(50)) and (signal>signal[3])
exitLong = (high > middleband)
strategy.entry(id = "Long", long = true, when = enterLong)
strategy.close(id = "Long", when = exitLong)
// === STRATEGY - SHORT POSITION EXECUTION ===
enterShort = (((high>=upperband1) and (close < upperband1)) or ((open >= upperband1) and (close < upperband1))) and (strategy.opentrades <1) and (atr(3) > atr(50)) and (signal<signal[3])
exitShort = (low < middleband)
strategy.entry(id = "Short", long = false, when = enterShort)
strategy.close(id = "Short", when = exitShort)
// === STRATEGY RISK MANAGEMENT EXECUTION ===
strategy.exit("Exit Long", from_entry = "Long", profit = useTakeProfit, loss = useStopLoss)
strategy.exit("Exit Short", from_entry = "Short", profit = useTakeProfit, loss = useStopLoss)
// === CHART OVERLAY ===
plot(upperband1, color=#C10C00, linewidth=3)
plot(lowerband1, color=#23E019, linewidth=3)
plot(middleband, color=#00E2E2, linewidth=3)
//plot(strategy.equity, title="equity", color=red, linewidth=2, style=areabr)