概述
本策略联合运用趋向指数和随机指标来产生交易信号。趋向指数中的DI+、DI-和ADX线用于判断趋势方向和力度,随机指标中的%K线用于判断是否超买超卖。策略在DI+高于DI-,ADX高于25并且%K低于20时产生多头信号;当DI-高于DI+,ADX高于25并且%K高于80时产生空头信号。同时,策略使用创新型的动态止损方式,以最后一个入场点之后的最高价和最低价作为动态止损位,有效控制风险。
策略原理
本策略的核心逻辑基于以下几个部分:
趋向指数判断趋势:通过DI+、DI-和ADX判断市场趋势的方向和力度。当DI+高于DI-,表示多头趋势;当DI-高于DI+,表示空头趋势。ADX用于判断趋势的力度,数值越大表示趋势越明显。
随机指标判断超买超卖:随机指标中的%K线显示当前收盘价相对于一定周期内的最高价和最低价的位置,用于判断市场是否超买超卖。当%K低于20时为超卖,高于80时为超买。
信号产生逻辑:结合趋向指数和随机指标,本策略在DI+高于DI-(多头趋势)、ADX高于25(趋势较明显)和%K低于20(超卖)时产生多头信号;在DI-高于DI+(空头趋势)、ADX高于25和%K高于80(超买)时产生空头信号。
动态止损方式:记录最后一个入场点之后的最高价和最低价,将其作为动态的止损位。这样可以根据市场波动来锁定利润或控制风险。
优势分析
本策略主要有以下几个优势:
结合趋向指数和随机指标双重判断,可靠性较高。趋向指数判断主趋势方向,随机指标捕捉局部特征,两者相辅相成。
创新型的动态止损机制。根据最近波动设定止损点,能够根据实际市场情况来控制风险,止损效果好。
策略参数较少,容易实现。主要参数只有指标计算长度,容易调整和优化策略。
可广泛适用于不同品种和周期。股票、外汇、加密货币等金融市场上都可以使用该策略。
使用pine脚本编写,可直接在交易平台中应用,方便快捷。
风险分析
本策略也存在一些风险需要注意:
当趋势震荡时,容易产生错误信号。此时ADX相对较低,应降低仓位规避风险。
随机指标本身就是一个后验指标,产生信号时市场可能已发生反转。应适当结合其他先行指标。
动态止损机制并不能完全避免巨大行情的冲击。建议合理设置止损位距离。
参数设置不当也会影响策略效果。应选择合适的指标长度参数。
需要密切跟踪整体市场环境。在重大黑天鹅事件发生时应暂停策略,避免异常损失。
优化方向
本策略可以从以下几个方面进行优化:
增加其他判断指标,形成多重过滤,提高信号的可靠性。例如加入均线判断趋势,MACD判断背离等。
优化参数设置,选择最佳的参数组合。可以通过回测历史数据,确定最合适的指标长度。
根据不同品种和交易周期设置不同的参数。适合高频交易的品种可以缩短计算周期。
结合getInfo函数和日志记录功能,输出详细的交易日志和指标数据,便于策略分析与优化。
在pine编辑器中添加图表绘制,显示交易信号点。同时可显示止损线的移动情况。
开发警报功能,在满足特定条件时发送消息提醒,便于及时干预交易。
总结
本策略综合运用趋向指数和随机指标的优势,判断趋势方向的同时定位超买超卖区域,从而产生交易信号。同时创新设计的动态止损方式,使风险控制更加智能化和自动化。该策略信号较为可靠,适用范围广,使用方便,是一种高效实用的量化交易策略。通过持续优化和完善,本策略有望获得更加卓越的策略表现。
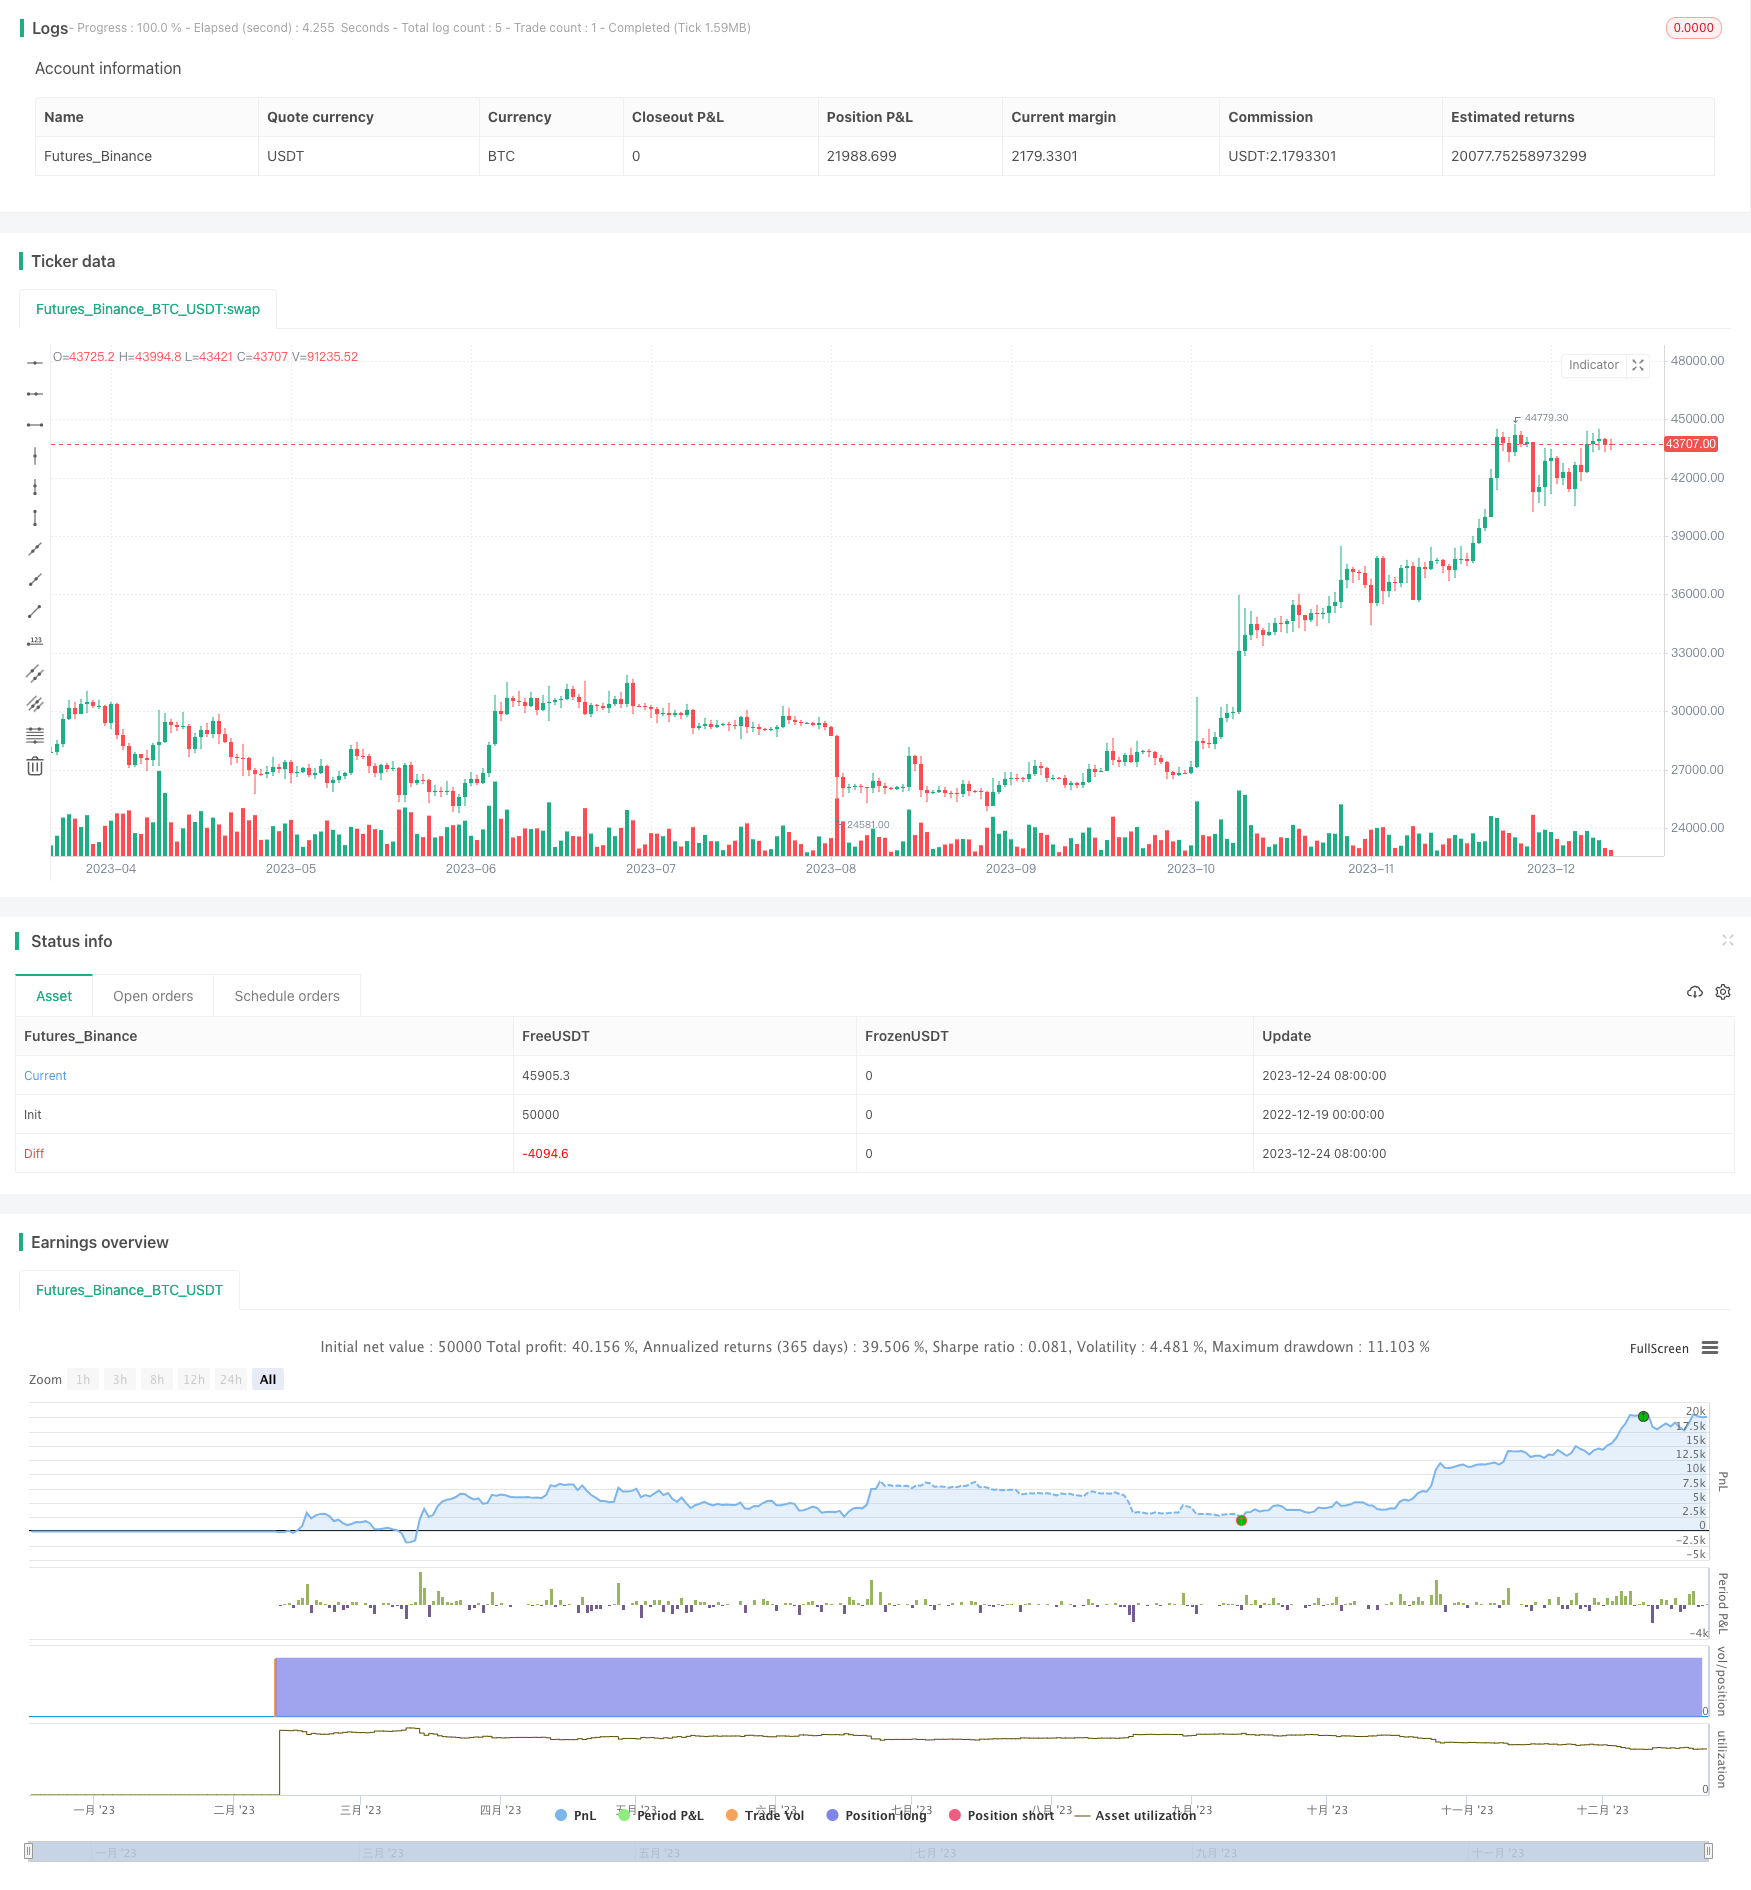
/*backtest
start: 2022-12-19 00:00:00
end: 2023-12-25 00:00:00
period: 1d
basePeriod: 1h
exchanges: [{"eid":"Futures_Binance","currency":"BTC_USDT"}]
*/

//@version=5
strategy("DMI with Stochastic and Dynamic Stop-Loss", shorttitle="DMI_Stoch_SL", overlay=true)

length = input(14, title="DMI Length")
adxThreshold = input(25, title="ADX Threshold")
stochKLength = input(14, title="Stochastic %K Length")
stochDLength = input(3, title="Stochastic %D Length")

[diPlus, diMinus, adx] = ta.dmi(length, length)
stochKLine = ta.stoch(close, high, low, stochKLength)

var float lowestClose = na
var float highestClose = na
lowestClose := na(lowestClose) ? close : math.min(lowestClose, close)
highestClose := na(highestClose) ? close : math.max(highestClose, close)

longCondition = (diPlus > diMinus) and (adx > adxThreshold) and (stochKLine < 20)
shortCondition = (diMinus > diPlus) and (adx > adxThreshold) and (stochKLine > 80)

if longCondition
    strategy.entry("Buy", strategy.long)
    strategy.exit("Exit Buy", "Buy", stop=lowestClose)

if shortCondition
    strategy.entry("Sell", strategy.short)
    strategy.exit("Exit Sell", "Sell", stop=highestClose)