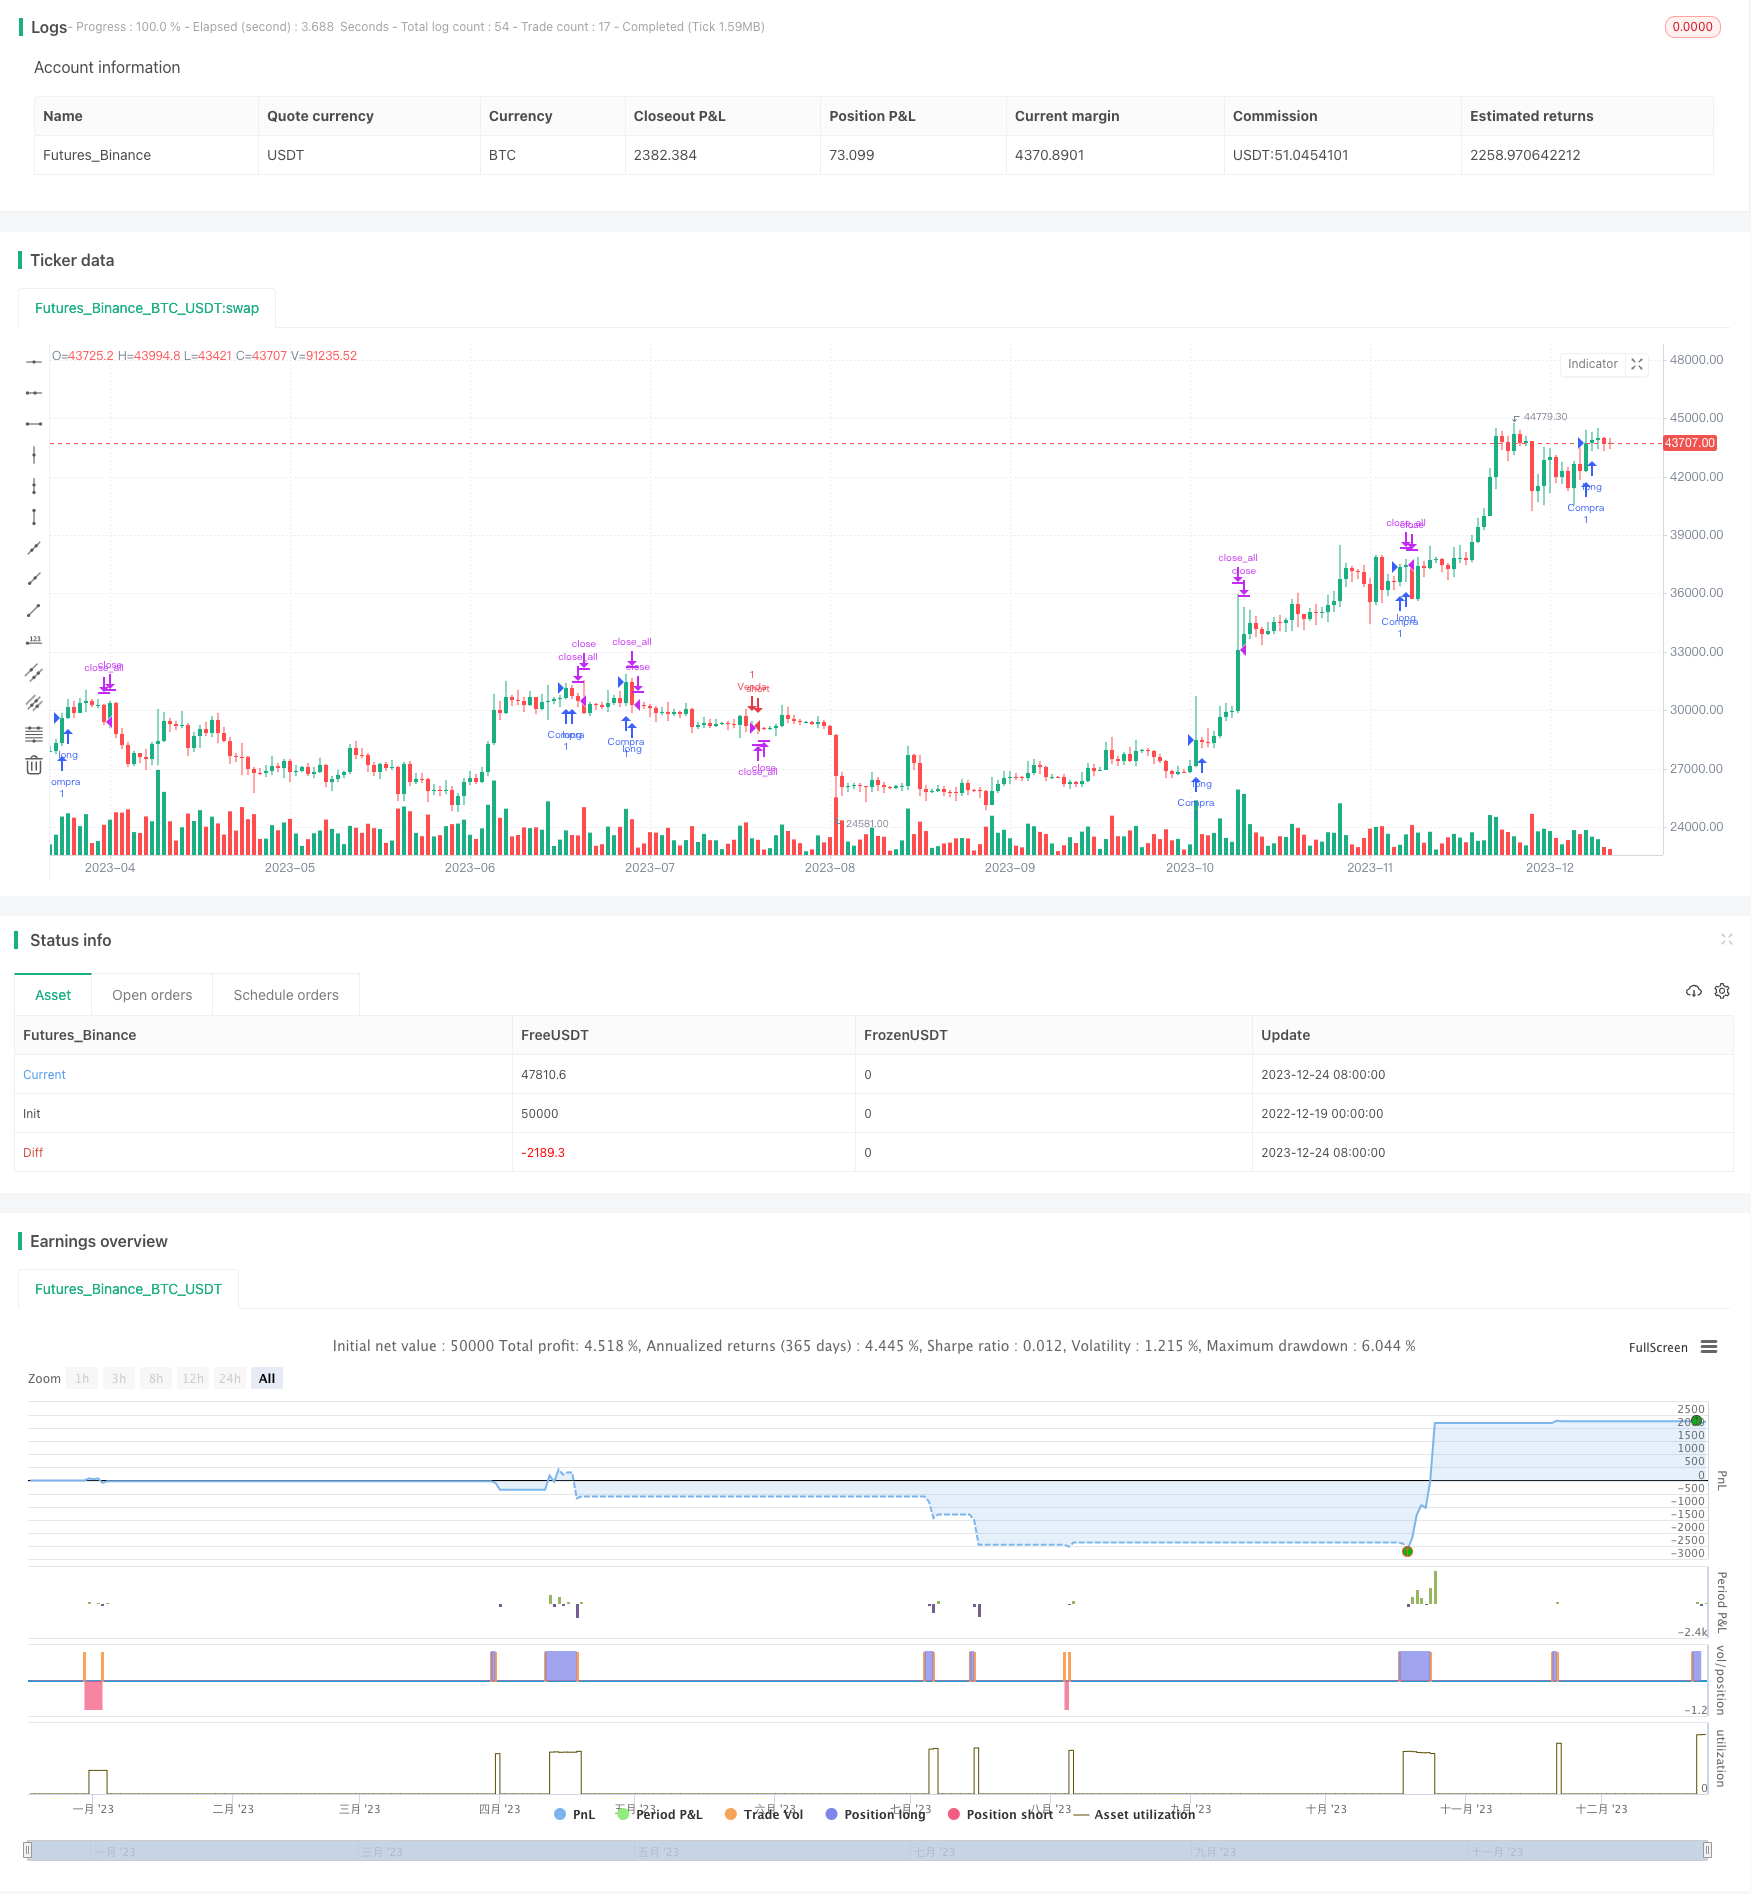
概述
该策略是一个简单经典的跨越移动平均线策略,由著名交易员莱瑞·威廉姆斯创造。策略使用 9 日简单移动平均线作为快线,21 日指数移动平均线作为慢线。当价格上涨突破 9 日线时做多,当价格下跌突破 9 日线时做空。为过滤假突破,还引入 21 日线辅助判断趋势。
策略原理
该策略基于移动平均线的黄金交叉和死亡交叉来判断做多和做空机会。当快线从下方上穿慢线时为黄金交叉,表示行情转 bullish,这样的突破做多;当快线 从上方下穿慢线时为死亡交叉,表示行情转 bearish,这样的突破做空。
为避免出现假突破导致虚拟损失,策略还引入 21 日线判断大趋势。只有在快线突破的同时,价格也突破 21 日线时,才采取交易行动。这样可以有效过滤掉许多假突破。
具体来说,做多的信号是:快线上涨突破昨日高点,同时快线突破 21 日线,这样多头才确立;做空信号是:快线下跌突破昨日低点,同时快线突破 21 日线,这样空头才确立。
优势分析
该策略优势主要体现在:
- 策略思路简单,容易理解和实现。
- 移动平均线技术成熟,使用广泛。
- 引入 21 日线有效过滤假突破。
- 采用昨日极值点位进场,可以防止被套。
- 策略参数比较稳健,不容易过拟合。
风险分析
该策略主要存在以下风险:
- 行情剧烈波动时,移动平均线生成滞后,可能错过最佳进场点位。
- 行情平行震荡时,容易产生频繁的小亏损。
- 无法有效应对突发事件引起的重大行情变化。
针对上述风险,可以通过以下方法加以优化和控制:
- 引入 MACD 指标辅助判断,获取更多实时性信号。
- 调高移动平均线周期参数,降低交易频率。
- 增加止损策略,控制单笔亏损。
优化方向
该策略主要可以从以下几个方向进行优化:
参数优化。可以通过更系统的方法对 MA 周期参数组合进行测试,找到更优参数。
增加止损。设定合理的移动止损、缩量止损等方法,有效控制单笔亏损。
结合其他指标。引入 MACD、ATR、KD 等其他指标信号,获得更多维度的确认,提高策略稳定性。
优化出场机制。研究不同类型的离场策略,如反转信号离场、移动止盈离场等方法。
总结
该跨越移动平均线策略总体而言是一个非常典型和实用的趋势跟踪策略。它有着易于理解和实现的优点,同时也存在一些改进空间。通过参数优化、止损优化、多指标结合等方法,可以持续对该策略进行改进,使其成为一个更加稳定和实用的交易系统。
策略源码
// @_benac
//@version=5
strategy('Larry', overlay=true , initial_capital=1000 )


////////////////////////////////////////////////////////
//                                                    //
//                                                    //
//                 Codigo Operacional                 //
//                                                    //
//                                                    //
////////////////////////////////////////////////////////

// Usage for Stocks , or Criptos with value bigger then 1, cuz of 0.01 ´pip.
// Daily timeframe
//Observation Point
start     = timestamp(2020, 00, 00, 00, 00)         // backtest start window
finish    = timestamp(2022, 01, 07, 23, 59)        // backtest finish window
window()  => true // create function "within window of time"

if time < start
    strategy.close_all("Closing All")

// Take infos from inputs.
inp_mmshort = input.int(defval = 9, title = "Media Curta"  )
inp_mminter = input.int(defval = 21, title = "Media Curta"  )

// Risk Manager, here define max and min
inp_max = input.int(defval = 15, title = "Percentual Ganho"  )
inp_min = input.int(defval = 5, title = "Percental  Perda"  )

// Converting the input to %
pmax = (inp_max / 100 )
pmin =  (inp_min / 100)

// Infos From Moving Average
mm_short = ta.sma(close , inp_mmshort)
mm_inter = ta.ema(close , inp_mminter)


// Trend Logic
//Long Condition

//Setup do Larry Willians Bem Simples , media virou para cima e rompeu a maxima de referencia, compra.
tendencia_alta = mm_short[2] > mm_short[1] and mm_short > mm_short[1] and close > high[1] and close > mm_short and mm_short > mm_inter
tendencia_baixa = mm_short[2] < mm_short[1] and mm_short < mm_short[1] and close > low[1] and close < mm_short and mm_short < mm_inter

// Creating the entry
if tendencia_alta
    strategy.entry("Compra" , strategy.long , stop = low - 0.01  )
    stop_inst = low - 0.01
if tendencia_baixa
    strategy.entry("Venda" , strategy.short , stop= high + 0.01  )
    stop_inst = high + 0.01


// TrailingStop Creation

// Sell Position
if strategy.position_size < 0
    gain_p = strategy.opentrades.entry_price(0) - (strategy.opentrades.entry_price(0) * pmax)
    stop_p = strategy.opentrades.entry_price(0) + (strategy.opentrades.entry_price(0) * pmin)
    // Managing the position
    if close < gain_p
        strategy.close_all(comment = " 1 - Ganho : " + str.tostring( gain_p) + " Perda : " + str.tostring( stop_p)  )
    if close > stop_p
        strategy.close_all(comment = " 2 - Ganho : " + str.tostring( gain_p) + " Perda : " + str.tostring( stop_p)  )

    if  high > mm_short[1]
        strategy.close_all(comment = " 3 - Ganho : " + str.tostring( gain_p) + " Perda : " + str.tostring( stop_p)  )


// Buy Position
if strategy.position_size > 0
    gain_p = strategy.opentrades.entry_price(0) + (strategy.opentrades.entry_price(0) * pmax)
    stop_p = strategy.opentrades.entry_price(0) - (strategy.opentrades.entry_price(0) * pmin)
    // Managing the position
    if close > gain_p
        strategy.close_all(comment = " 1- Ganho : " + str.tostring( gain_p) + " Perda : " + str.tostring( stop_p)  )
    if close < stop_p
        strategy.close_all(comment = " 2 -Ganho : " + str.tostring( gain_p) + " Perda : " + str.tostring( stop_p)  )
    if low < mm_short[1]
        strategy.close_all(comment = " 3 -Ganho : " + str.tostring( gain_p) + " Perda : " + str.tostring( stop_p)  )