概述
彩虹震荡器回测策略是一种基于彩虹震荡器指标的量化交易策略。该策略通过计算股价与均线之间的偏离程度,来判断市场的趋势方向和力度,以此来进行长短仓方向的判断。
策略原理
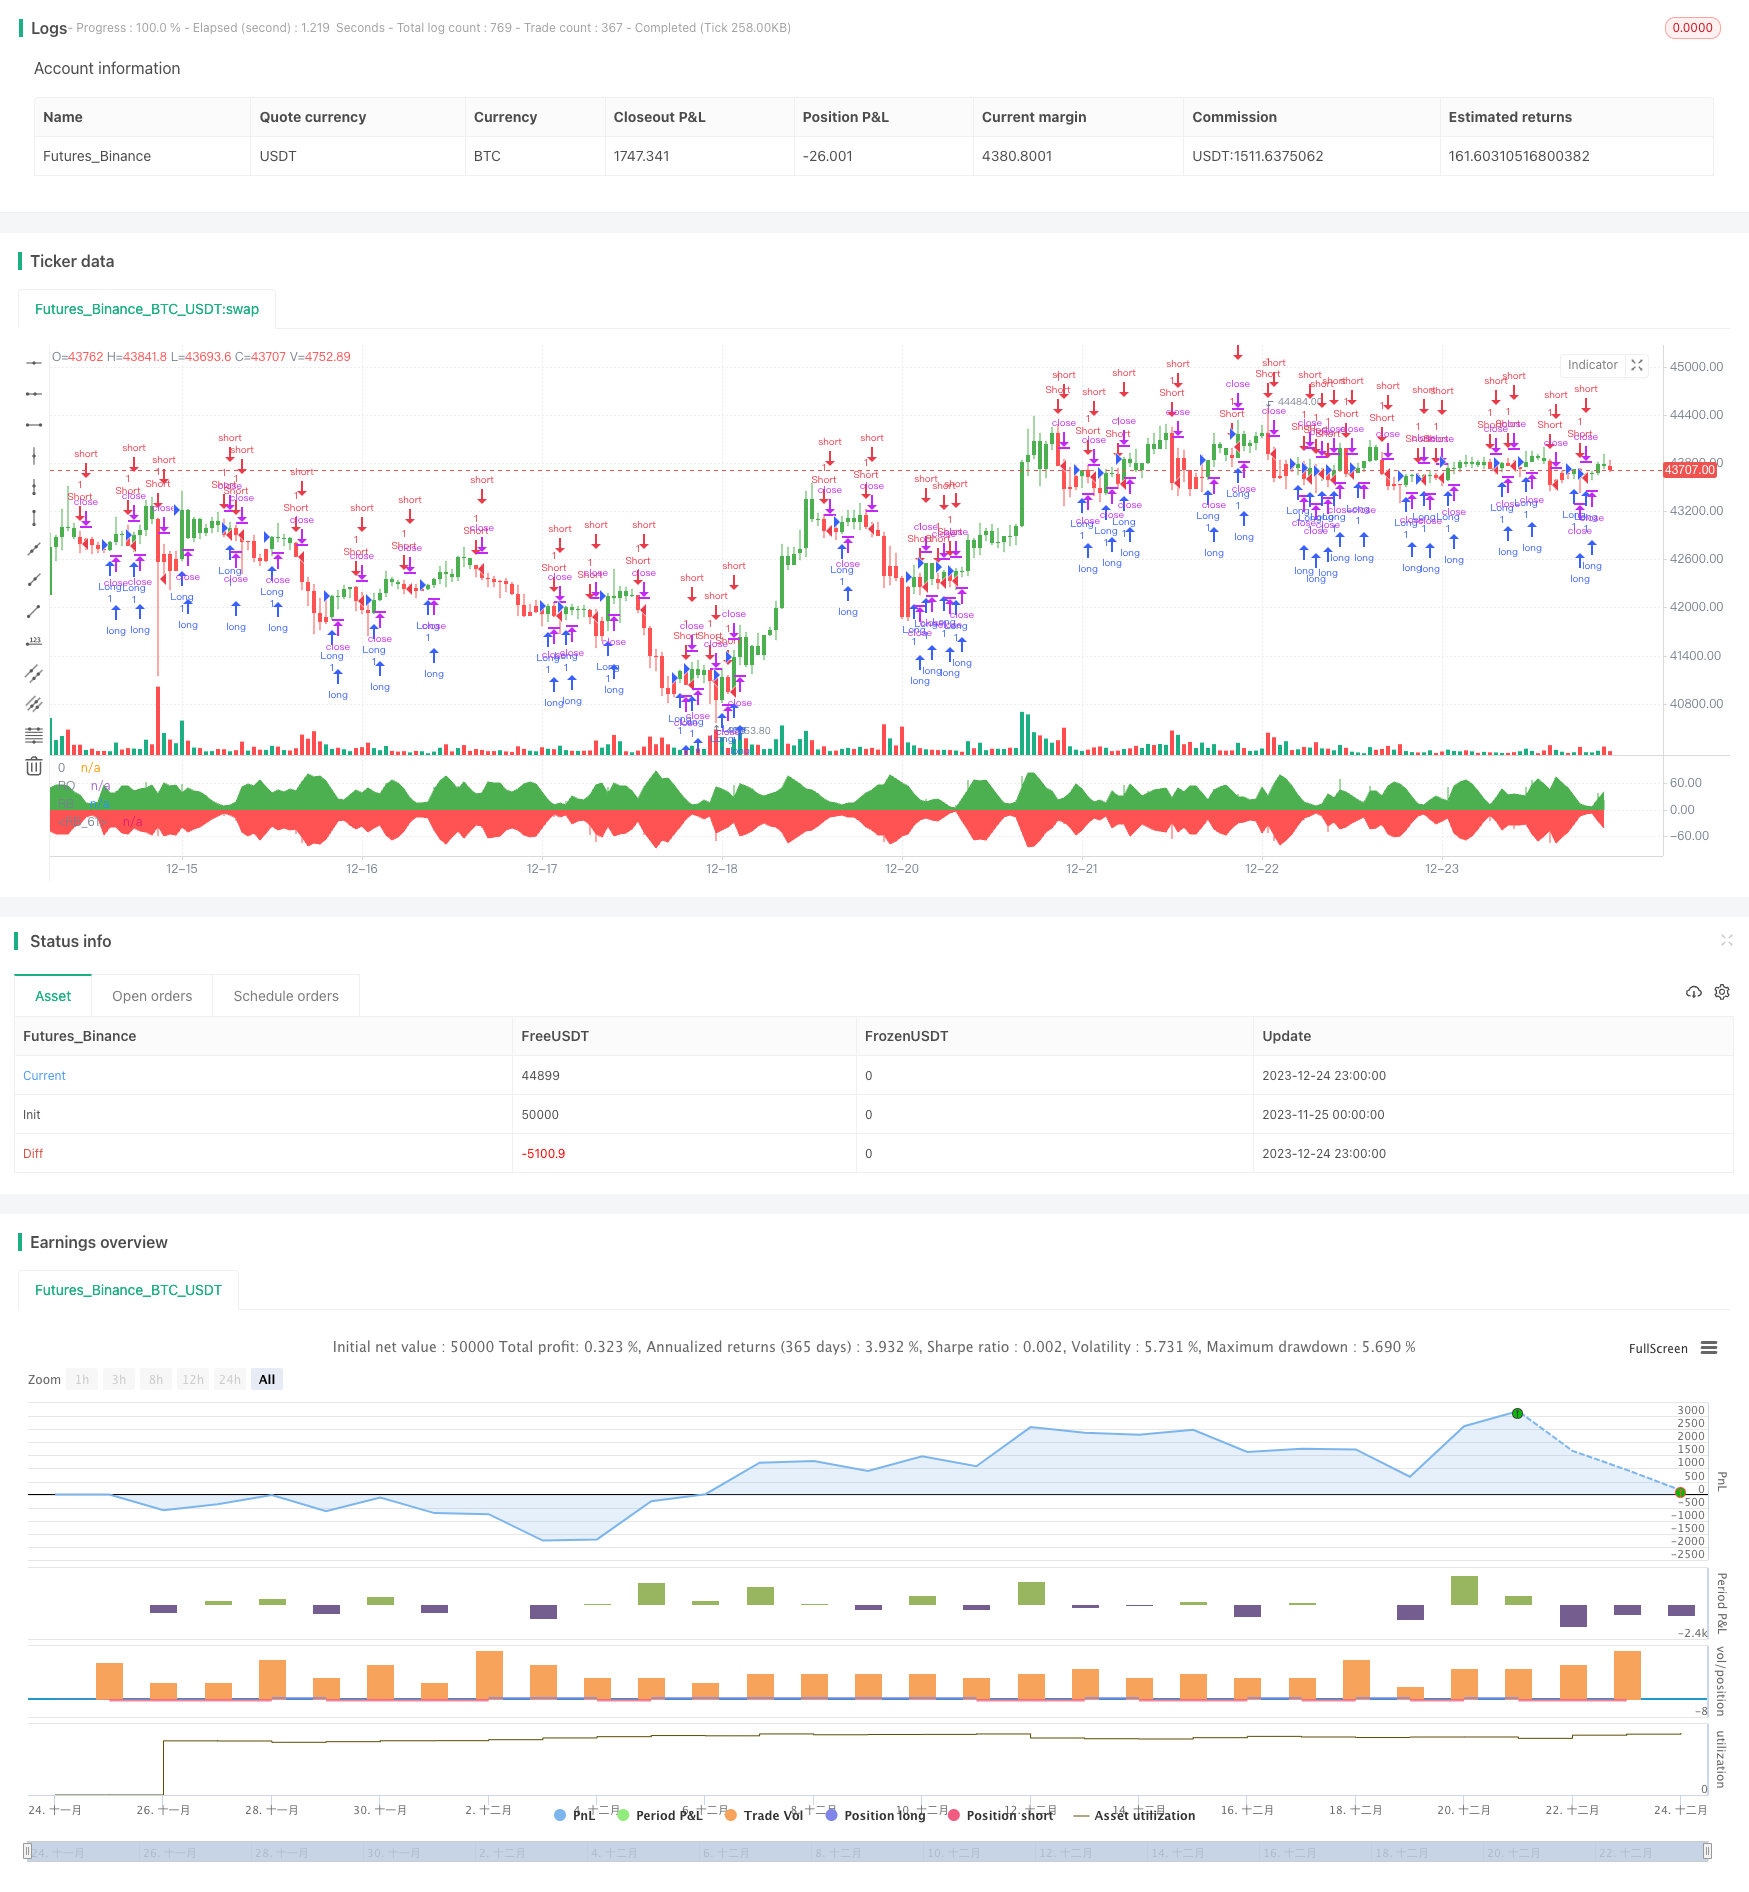
该策略的核心指标是彩虹震荡器(Rainbow Oscillator,RO),其计算公式如下:
RO = 100 * ((收盘价 - 10日移动平均线) / (最高价的最高值 - 最低价的最低值))
其中10日移动平均线是10个周期收盘价的简单移动平均。该指标反映了价格相对于自身均线的偏离情况。当RO > 0时,代表价格在均线之上,为看涨信号;当RO < 0时,代表价格在均线之下,为看跌信号。
该策略还计算了一个辅助指标——带宽(Bandwidth,RB),其计算公式如下:
RB = 100 * ((均线的最高值 - 均线的最低值) / (最高价的最高值 - 最低价的最低值))
RB反映了均线之间的宽度。RB越大,说明价格波动越大,反之则价格稳定。RB指标可用于判断市场的稳定程度。
根据RO和RB指标的值,该策略判断价格偏离程度和市场稳定性,以此产生长仓和短仓的交易信号。
策略优势
该策略具有以下优势:
- 基于双指标判断,避免了单一指标判断的局限性。
- 可同时判断价格走势和市场稳定性。
- 计算简单,容易理解和实现。
- 可视化指标,形成“彩虹”效果,直观易读。
策略风险
该策略也存在一些风险:
- RO和RB指标参数设置不当可能导致交易信号错误。
- 双均线策略容易产生错误信号和频繁交易。
- 回测周期和品种选择不当会影响策略效果。
- 没有考虑交易成本,实盘效果可能不佳。
对策:
- 优化RO和RB指标的参数。
- 增加过滤条件,避免频繁交易。
- 选择合适的回测周期和品种。
- 计算并考虑交易成本。
策略优化
该策略还可以从以下几个方面进行优化:
- 对RO指标加入Smooth功能,避免指标剧烈波动。
- 加入止损策略,控制单笔损失。
- 结合其他指标进行组合交易,提高获利概率。
- 增加机器学习模型进行预测,判断指标效果。
- 针对不同品种参数进行优化,提高适应性。
总结
彩虹震荡器回测策略通过计算价格与均线之间的偏离关系,判断市场趋势和稳定性,以此进行长短仓交易。该策略直观易读,实现简单,具有一定的实用价值。但也存在一些风险,需要针对参数和交易规则进行优化,降低风险,提高实盘效果。
策略源码
/*backtest
start: 2023-11-25 00:00:00
end: 2023-12-25 00:00:00
period: 1h
basePeriod: 15m
exchanges: [{"eid":"Futures_Binance","currency":"BTC_USDT"}]
*/

//@version=2
////////////////////////////////////////////////////////////
//  Copyright by HPotter v1.0 18/03/2018
// Ever since the people concluded that stock market price movements are not
// random or chaotic, but follow specific trends that can be forecasted, they
// tried to develop different tools or procedures that could help them identify
// those trends. And one of those financial indicators is the Rainbow Oscillator
// Indicator. The Rainbow Oscillator Indicator is relatively new, originally
// introduced in 1997, and it is used to forecast the changes of trend direction.
//
// As market prices go up and down, the oscillator appears as a direction of the
// trend, but also as the safety of the market and the depth of that trend. As
// the rainbow grows in width, the current trend gives signs of continuity, and
// if the value of the oscillator goes beyond 80, the market becomes more and more
// unstable, being prone to a sudden reversal. When prices move towards the rainbow
// and the oscillator becomes more and more flat, the market tends to remain more
// stable and the bandwidth decreases. Still, if the oscillator value goes below 20,
// the market is again, prone to sudden reversals. The safest bandwidth value where
// the market is stable is between 20 and 80, in the Rainbow Oscillator indicator value.
// The depth a certain price has on a chart and into the rainbow can be used to judge
// the strength of the move.
//
// You can change long to short in the Input Settings
// WARNING:
//  - For purpose educate only
//  - This script to change bars colors.
////////////////////////////////////////////////////////////
strategy(title="Rainbow Oscillator Backtest")
Length = input(2, minval=1)
LengthHHLL = input(10, minval=2, title="HHV/LLV Lookback")
reverse = input(false, title="Trade reverse")
xMA1 = sma(close, Length)
xMA2 = sma(xMA1, Length)
xMA3 = sma(xMA2, Length)
xMA4 = sma(xMA3, Length)
xMA5 = sma(xMA4, Length)
xMA6 = sma(xMA5, Length)
xMA7 = sma(xMA6, Length)
xMA8 = sma(xMA7, Length)
xMA9 = sma(xMA8, Length)
xMA10 = sma(xMA9, Length)
xHH = highest(close, LengthHHLL)
xLL = lowest(close, LengthHHLL)
xHHMAs = max(xMA1,max(xMA2,max(xMA3,max(xMA4,max(xMA5,max(xMA6,max(xMA7,max(xMA8,max(xMA9,xMA10)))))))))
xLLMAs = min(xMA1,min(xMA2,min(xMA3,min(xMA4,min(xMA5,min(xMA6,min(xMA7,min(xMA8,min(xMA9,xMA10)))))))))
xRBO = 100 * ((close - ((xMA1+xMA2+xMA3+xMA4+xMA5+xMA6+xMA7+xMA8+xMA9+xMA10) / 10)) / (xHH - xLL))
xRB = 100 * ((xHHMAs - xLLMAs) / (xHH - xLL))
clr = iff(xRBO >= 0, green, red)
pos = iff(xRBO > 0, 1,
       iff(xRBO < 0, -1, nz(pos[1], 0)))
possig = iff(reverse and pos == 1, -1,
          iff(reverse and pos == -1, 1, pos))
if (possig == 1)
    strategy.entry("Long", strategy.long)
if (possig == -1)
    strategy.entry("Short", strategy.short)
barcolor(possig == -1 ? red: possig == 1 ? green : blue )
plot(xRBO, color=clr, title="RO", style= histogram, linewidth=2)
p0 = plot(0, color = gray, title="0")
p1 = plot(xRB, color=green, title="RB")
p2 = plot(-xRB, color=red, title="RB")
fill(p1, p0, color=green)
fill(p2, p0, color=red)