概述
惯性指标交易策略是基于相对波动指数(RVI)的趋势跟踪型算法交易策略。该策略通过计算证券的RVI,来测量市场、股票或货币对的动量和趋势。它可以判断长期趋势的方向,作为建立trading position的信号。
策略原理
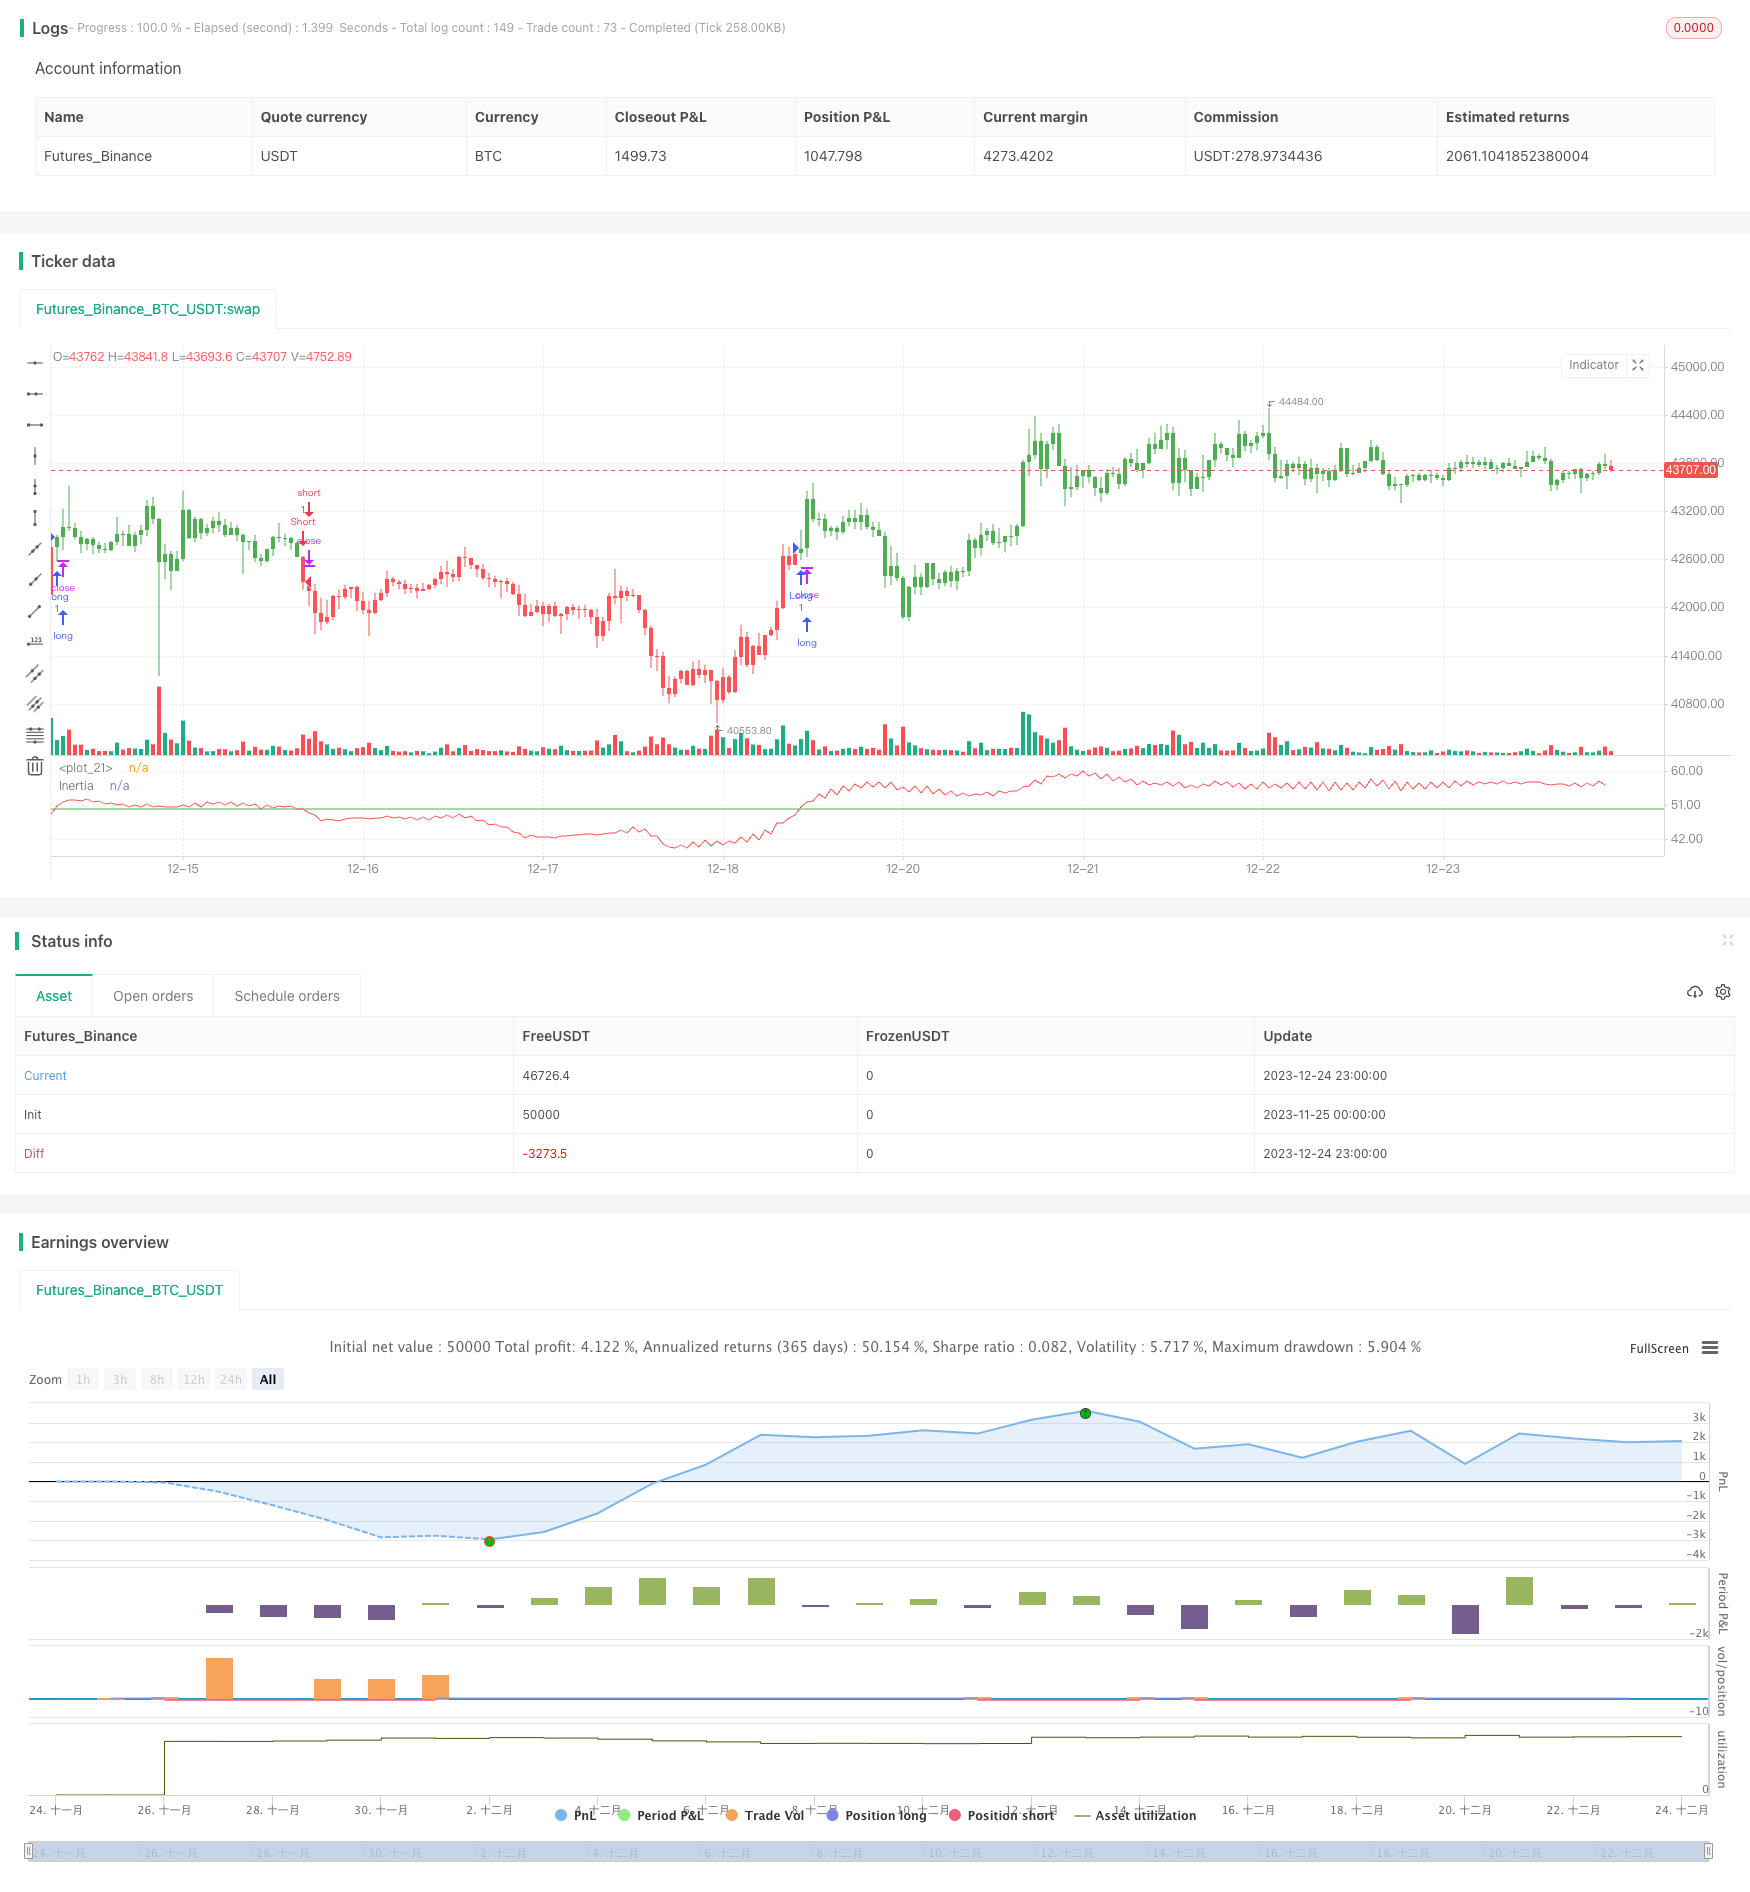
该策略的核心指标是惯性指标(Inertia Indicator),它取值范围在0到100之间。指标大于50代表正向惯性,小于50代表负向惯性。只要惯性值持续大于50,就可以判断长期趋势向上;反之,则为下降趋势。
指标的计算过程如下:
- 计算指定周期内的股票收盘价标准差StdDev
- 根据今日收盘价与昨日收盘价的比较,计算向上波动u和向下波动d
- 计算并平滑u和d,得到指标nU和nD
- 计算相对波动指数nRVI = 100 * nU / (nU + nD)
- 对nRVI进行指数移动平均,得到最终的惯性值nRes
如果nRes大于50代表正向惯性,会产生买入信号;如果小于50代表负向惯性,会产生卖出信号。
优势分析
该策略最大的优势在于能够顺势而为,捕捉市场趋势,避免在震荡行情中频繁开仓。另外,相对简单的指标计算,对计算资源要求不高,适合算法交易。
风险分析
该策略最大的风险在于,指标本身存在滞后,无法做到百分百捕捉转折点。这可能导致错过较优开仓时机。另外,指标的参数设置也会影响策略表现,需要经过大量回测找到最优参数。
为降低风险,可以考虑与其他技术指标或基本面指标结合使用,利用更多因素来决定开仓。同时要控制单笔交易的头寸规模。
优化方向
该策略可以从以下几个方面进行优化:
参数优化。改变周期参数和平滑参数的设置,找到最优参数组合。
结合其他指标。与移动平均线、RSI等指标结合使用,利用更多因素决策。
动态仓位管理。根据市场状况和指标数值,动态调整每个交易的头寸规模。
自动止损策略。设定止损位置,能够有效控制单笔交易的最大损失。
总结
惯性指标交易策略整体来说是一种较为简单可靠的趋势跟踪策略。它根据惯性指标判断价格趋势方向,并顺势建立trading position。通过参数优化、指标组合等方式进一步增强策略效果,是一种适合量化交易的算法策略。
策略源码
/*backtest
start: 2023-11-25 00:00:00
end: 2023-12-25 00:00:00
period: 1h
basePeriod: 15m
exchanges: [{"eid":"Futures_Binance","currency":"BTC_USDT"}]
*/

//@version=2
////////////////////////////////////////////////////////////
//  Copyright by HPotter v1.0 23/05/2017
// The inertia indicator measures the market, stock or currency pair momentum and
// trend by measuring the security smoothed RVI (Relative Volatility Index).
// The RVI is a technical indicator that estimates the general direction of the
// volatility of an asset.
// The inertia indicator returns a value that is comprised between 0 and 100.
// Positive inertia occurs when the indicator value is higher than 50. As long as
// the inertia value is above 50, the long-term trend of the security is up. The inertia
// is negative when its value is lower than 50, in this case the long-term trend is
// down and should stay down if the inertia stays below 50.
//
// You can change long to short in the Input Settings
// Please, use it only for learning or paper trading. Do not for real trading.
////////////////////////////////////////////////////////////
strategy(title="Inertia Indicator", shorttitle="Inertia")
Period = input(10, minval=1)
Smooth = input(14, minval=1)
reverse = input(false, title="Trade reverse")
hline(50, color=green, linestyle=line)
xPrice = close
StdDev = stdev(xPrice, Period)
d = iff(close > close[1], 0, StdDev)
u = iff(close > close[1], StdDev, 0)
nU = (13 * nz(nU[1],0) + u) / 14
nD = (13 * nz(nD[1],0) + d) / 14
nRVI = 100 * nU / (nU + nD)
nRes = ema(nRVI, Smooth)
pos = iff(nRes > 50, 1,
	     iff(nRes < 50, -1, nz(pos[1], 0)))
possig = iff(reverse and pos == 1, -1,
          iff(reverse and pos == -1, 1, pos))
if (possig == 1)
    strategy.entry("Long", strategy.long)
if (possig == -1)
    strategy.entry("Short", strategy.short)
barcolor(possig == -1 ? red: possig == 1 ? green : blue )
plot(nRes, color=red, title="Inertia")