概述
该策略名称为“融合双重趋势信号的反转指数量化策略”。它融合了两种不同的策略信号,一种是基于随机指标的短期反转信号,另一种是基于成交量的长期趋势信号,两者结合形成稳定的入场信号。
策略原理
该策略由两部分组成。第一部分使用9日Stoch指标生成短期反转信号。具体来说,如果收盘价较前一日收高,同时9日快线低于50而慢线高于50时做多;如果收盘价较前一日收低,同时9日快线高于50而慢线低于50时做空。这样利用Stoch指标的金叉死叉形成短期反转信号。
第二部分使用负成交量指数(NVI)形成长期趋势信号。NVI的计算公式是,如果当日成交量少于前一日,则将当日的收盘价变动率累加;如果当日成交量大于或等于前一日,则维持前一日的值不变。通过NVI指标的移动均线形成长期趋势信号。
最后,该策略将两种信号结合。只有当短期反转信号和长期趋势信号同向时,才会形成入场信号。这有助于过滤假信号,增强稳定性。
优势分析
该策略最大的优势在于信号稳定。短期反转信号能捕捉市场的短期调整,长期趋势信号确保了大趋势不变。两者的结合大大增强了信号的稳定性,能有效过滤误报率较高的短期信号。
另外,该策略参数较少,容易优化。用户只需要调整NVI的参数就可以适应不同市场的特征。
风险分析
该策略最大的风险在于两种信号之间可能存在时间差。短期反转信号和长期趋势信号之间可能存在一定的滞后,这会导致一段时间内两种信号不一致,无法形成稳定的入场信号。
另外,NVI指标对异常巨量的成交量变化也较敏感,这可能导致错误的长期趋势判断。
为降低这些风险,可以适当调整NVI指标参数,或者增加止损来控制单笔损失。
优化方向
该策略主要可以从以下几个方面进行优化:
优化Stoch指标的参数,提高反转捕捉能力。
优化NVI指标的长度周期,增强识别长期趋势的能力。
增加成交量过滤条件,排除成交量异常的假信号。
增加止损策略,控制单笔损失。
总结
该策略基于短期反转和长期趋势的思路设计稳定的入场机制,能有效控制误报率,增强信号的稳定性。下一步可以从调整参数、增加过滤条件等方面进行优化,进一步提高策略的稳定性。
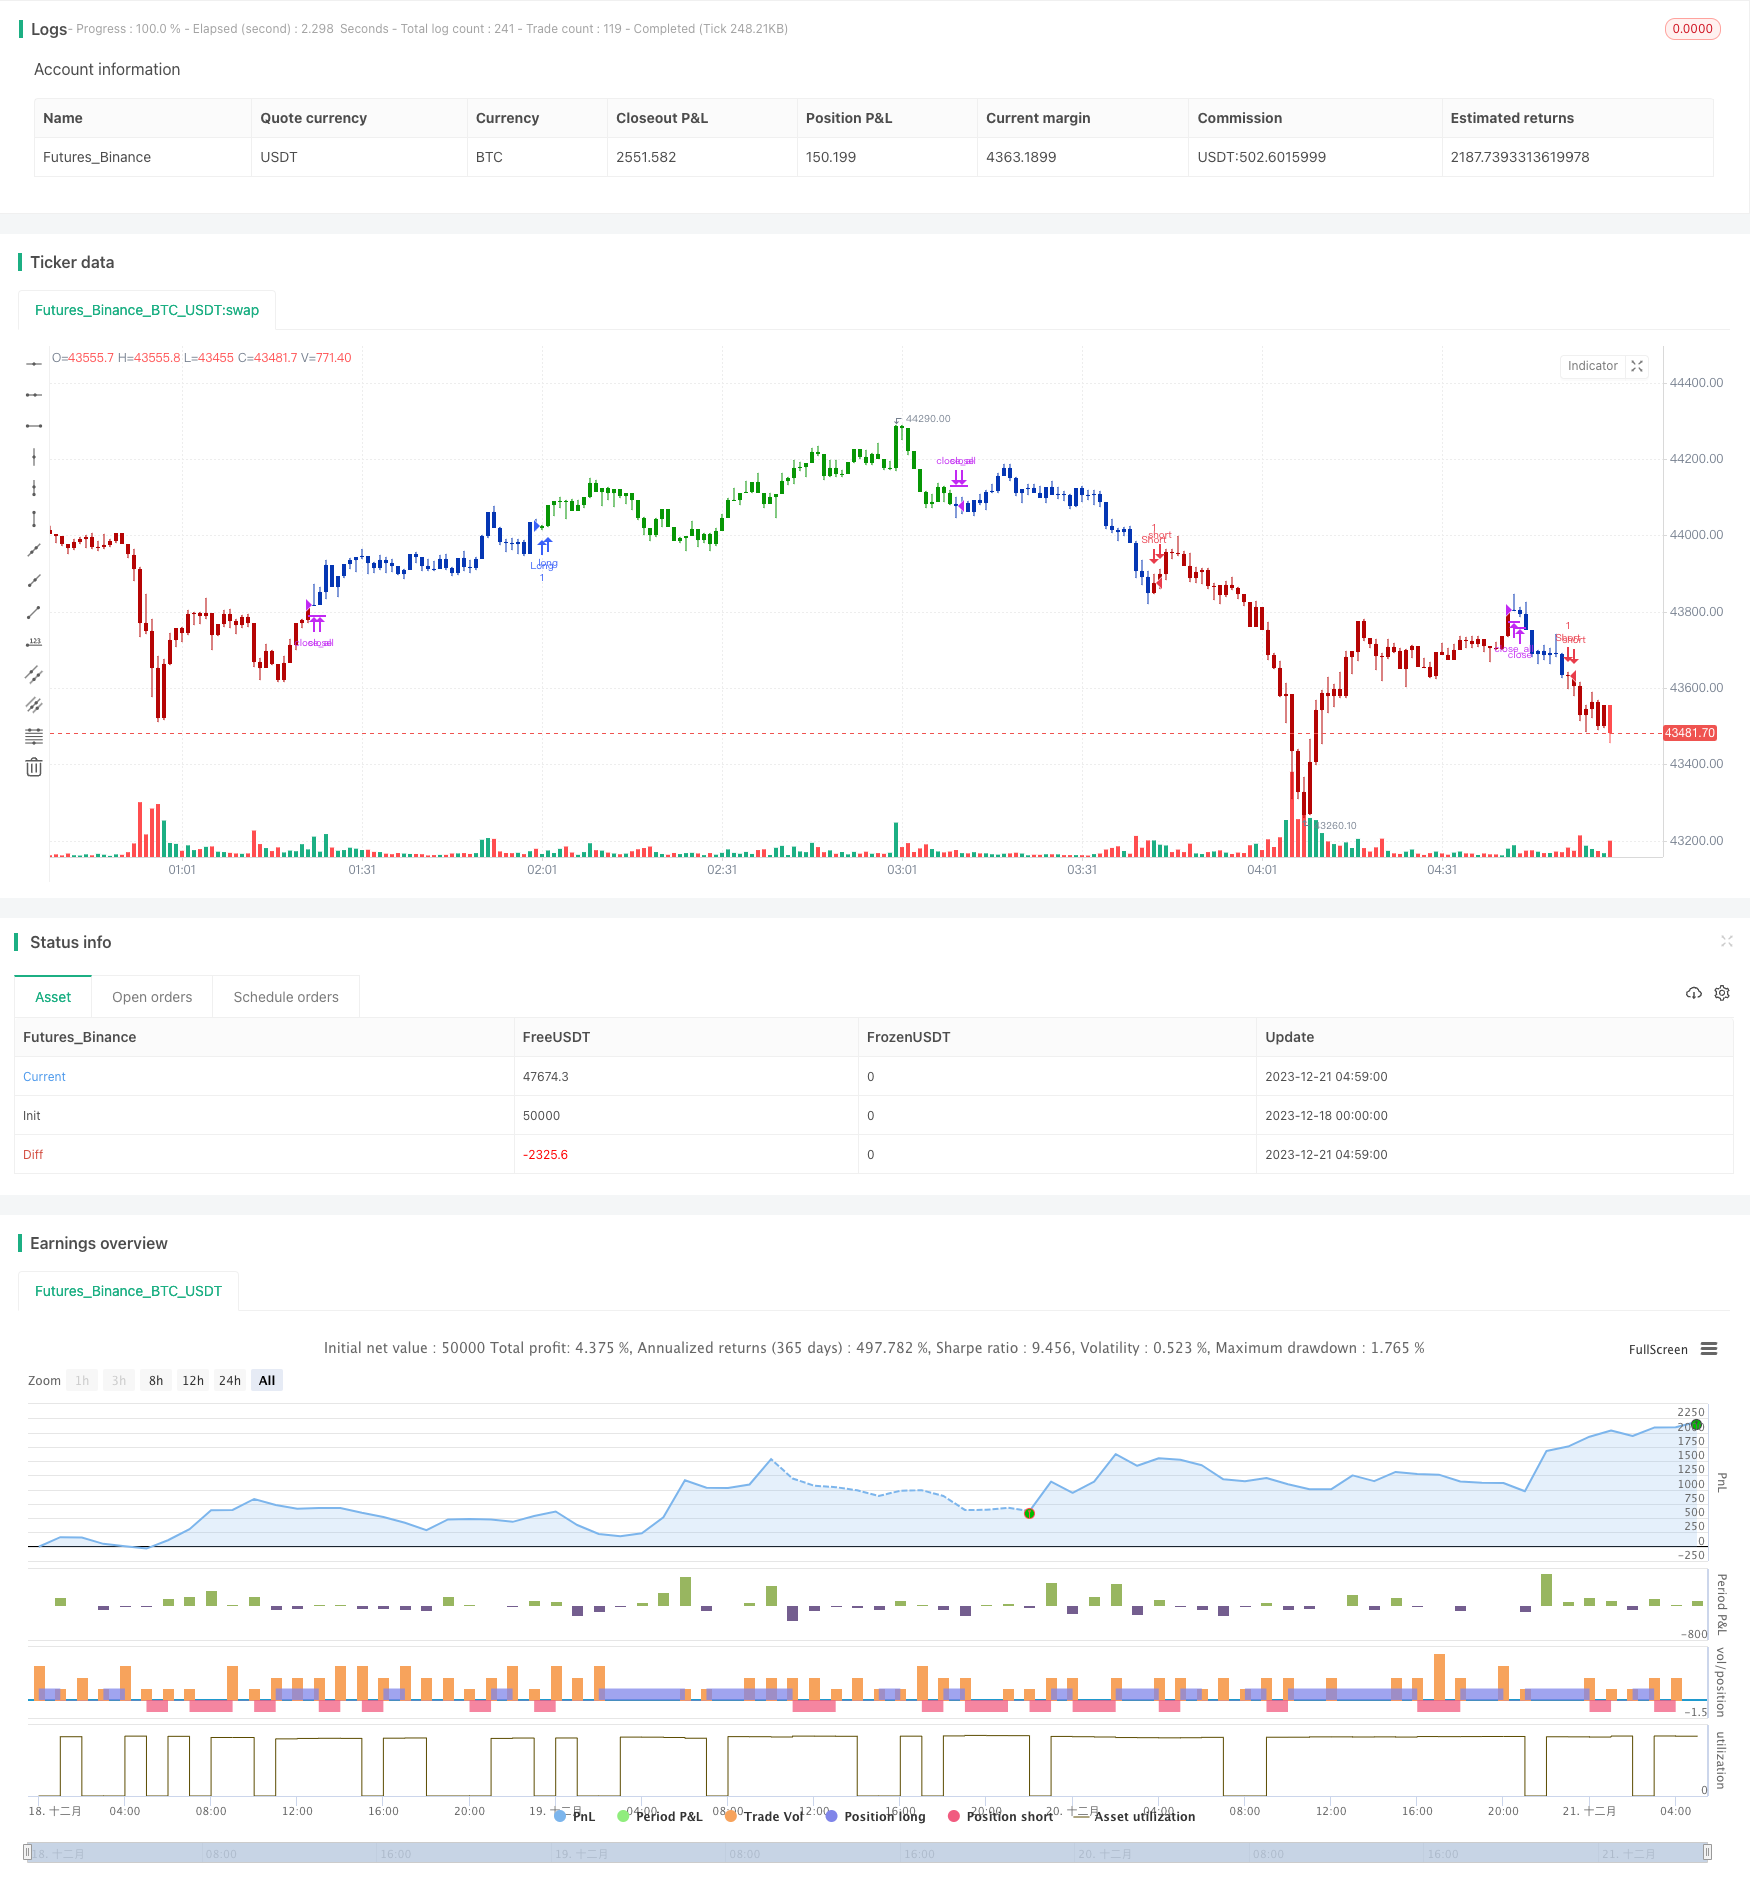
/*backtest
start: 2023-12-18 00:00:00
end: 2023-12-21 05:00:00
period: 1m
basePeriod: 1m
exchanges: [{"eid":"Futures_Binance","currency":"BTC_USDT"}]
*/

//@version=4
////////////////////////////////////////////////////////////
//  Copyright by HPotter v1.0 29/03/2021
// This is combo strategies for get a cumulative signal.
//
// First strategy
// This System was created from the Book "How I Tripled My Money In The
// Futures Market" by Ulf Jensen, Page 183. This is reverse type of strategies.
// The strategy buys at market, if close price is higher than the previous close
// during 2 days and the meaning of 9-days Stochastic Slow Oscillator is lower than 50.
// The strategy sells at market, if close price is lower than the previous close price
// during 2 days and the meaning of 9-days Stochastic Fast Oscillator is higher than 50.
//
// Second strategy
// The theory behind the indexes is as follows: On days of increasing
// volume, you can expect prices to increase, and on days of decreasing
// volume, you can expect prices to decrease. This goes with the idea of
// the market being in-gear and out-of-gear. Both PVI and NVI work in similar
// fashions: Both are a running cumulative of values, which means you either
// keep adding or subtracting price rate of change each day to the previous day`s
// sum. In the case of PVI, if today`s volume is less than yesterday`s, don`t add
// anything; if today`s volume is greater, then add today`s price rate of change.
// For NVI, add today`s price rate of change only if today`s volume is less than
// yesterday`s.
//
// WARNING:
// - For purpose educate only
// - This script to change bars colors.
////////////////////////////////////////////////////////////
Reversal123(Length, KSmoothing, DLength, Level) =>
    vFast = sma(stoch(close, high, low, Length), KSmoothing)
    vSlow = sma(vFast, DLength)
    pos = 0.0
    pos := iff(close[2] < close[1] and close > close[1] and vFast < vSlow and vFast > Level, 1,
	         iff(close[2] > close[1] and close < close[1] and vFast > vSlow and vFast < Level, -1, nz(pos[1], 0)))
	pos


NVI(EMA_Len) =>
    pos = 0.0
    nRes = 0.0
    xROC = roc(close, EMA_Len)
    nRes := iff(volume < volume[1], nz(nRes[1], 0) + xROC, nz(nRes[1], 0))
    nResEMA = ema(nRes, EMA_Len)
    pos := iff(nRes > nResEMA, 1,
    	     iff(nRes < nResEMA, -1, nz(pos[1], 0)))
    pos

strategy(title="Combo Backtest 123 Negative Volume Index", shorttitle="Combo", overlay = true)
line1 = input(true, "---- 123 Reversal ----")
Length = input(14, minval=1)
KSmoothing = input(1, minval=1)
DLength = input(3, minval=1)
Level = input(50, minval=1)
//-------------------------
line2 = input(true, "---- Negative Volume Index ----")
EMA_Len = input(50, minval=1)
reverse = input(false, title="Trade reverse")
posReversal123 = Reversal123(Length, KSmoothing, DLength, Level)
posNVI = NVI(EMA_Len)
pos = iff(posReversal123 == 1 and posNVI == 1 , 1,
	   iff(posReversal123 == -1 and posNVI == -1, -1, 0))
possig = iff(reverse and pos == 1, -1,
          iff(reverse and pos == -1 , 1, pos))
if (possig == 1 )
    strategy.entry("Long", strategy.long)
if (possig == -1 )
    strategy.entry("Short", strategy.short)
if (possig == 0)
    strategy.close_all()
barcolor(possig == -1 ? #b50404: possig == 1 ? #079605 : #0536b3 )