概述
该策略通过计算双均线的交叉情况,判断价格趋势和交易机会。当快线上穿慢线时,认为是黄金交叉,做多;当快线下穿慢线时,认为是死亡交叉,做空。同时结合量能指标判断真实交叉,避免虚假信号。
策略原理
该策略主要基于以下原理:
计算两组不同参数的均线,一组快速响应价格变化,一组相对缓慢。当快线上穿慢线时,表明价格启动上涨趋势;当快线下穿慢线时,表明价格开始下跌。
均线交叉时,再检测量能指标的变化。如果量能指标同步突破,说明交叉信号可信;如果量能指标没有对应突破,则可能是虚假信号。
根据交叉方向和量能判断,进入做多或做空仓位。并设置止盈条件,在盈利达到一定比例时止盈。
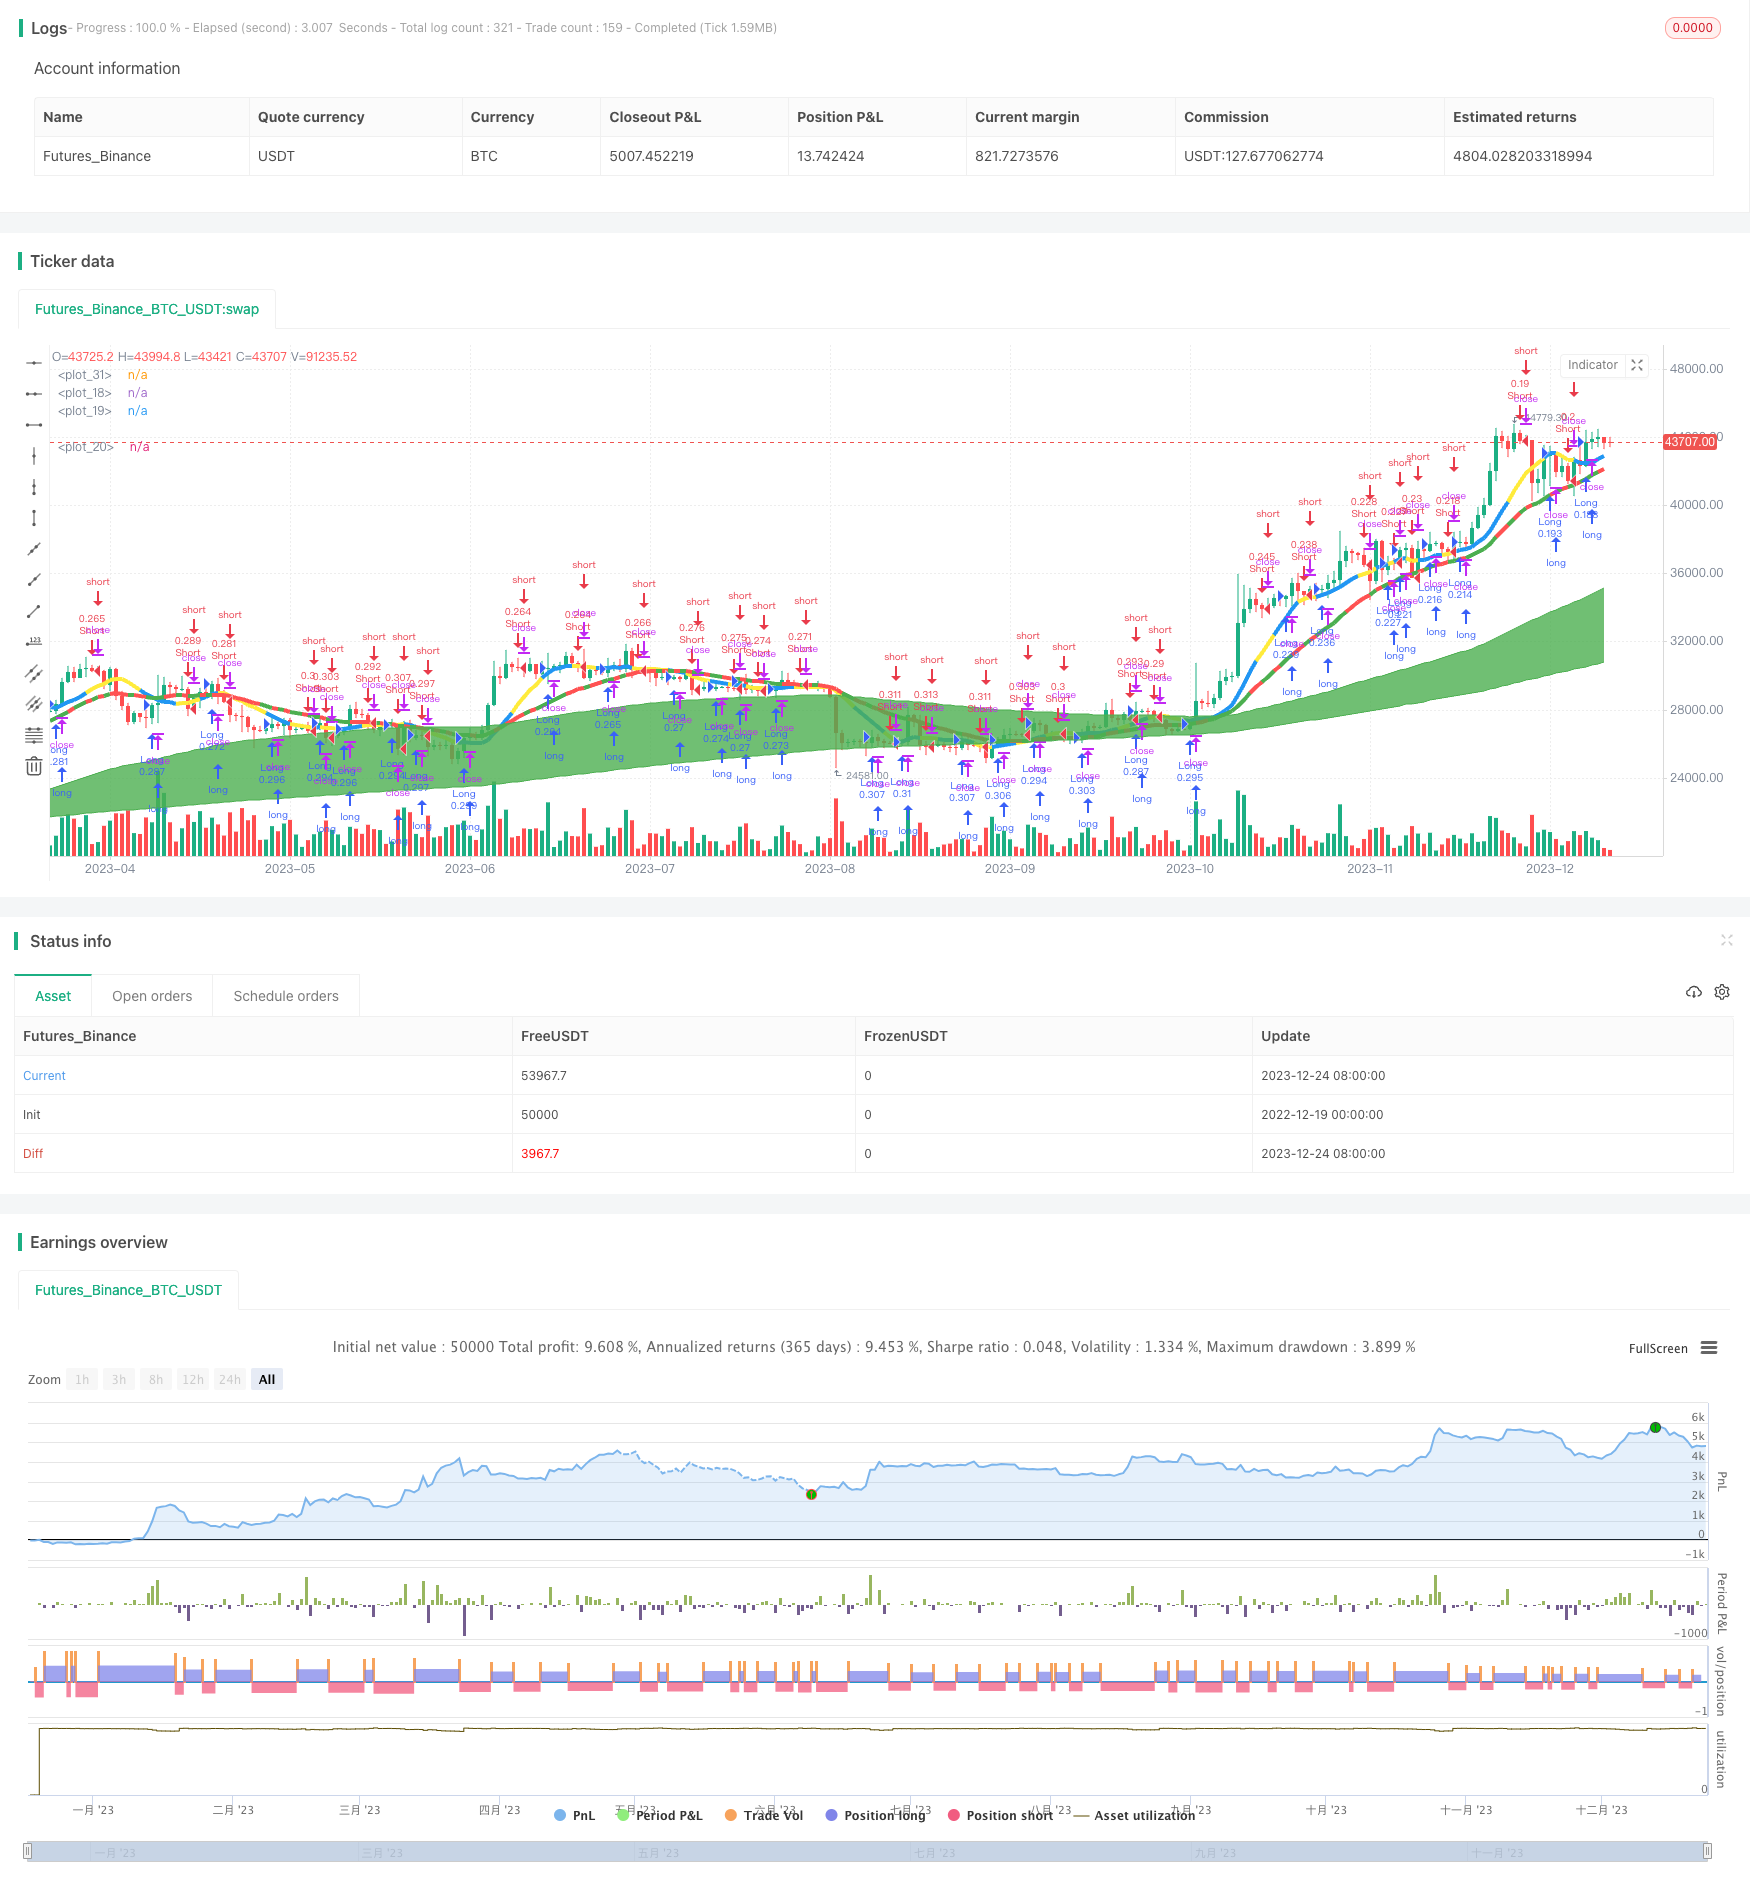
具体来说,策略通过计算7日双均线的交叉,判定价格趋势;计算量变动指标,判断交叉信号的可靠性;在确定可靠信号时,按 SIGNAL 做多或做空;设置盈利条件,实现止盈。
优势分析
该策略主要优势有:
- 结合双均线判断趋势方向,又结合量能指标过滤虚假信号,避免被套。
- 只在量能指标确认时才入场,增加成功率。
- 设定止盈条件,及时止盈,避免赚了钱还要亏钱。
风险分析
该策略主要风险有:
- 均线交叉延迟,容易错过价格变化的最佳机会点。可以适当优化参数,使均线更敏感。
- 量能指标出现分歧时难以判断。可以引入更多辅助指标进行确认。
- 止盈点设置不合理可能导致超短线或超长线操作。应测试和优化止盈参数。
优化方向
该策略可从以下方向进行优化:
- 优化均线周期参数,使其更敏感,及时捕捉价格变化。
- 增加更多指标进行信号确认,如MACD,KD等,避免量能指标出现误判。
- 结合更多止盈策略,如移动止盈、百分比止盈、震荡止盈等,实现动态止盈。
- 增加自动止损策略,控制单笔损失。
- 优化仓位管理,不同市场环境下,调整策略仓位。
总结
该策略整体来说,核心思路是双均线交叉判断趋势,量能指标过滤信号。效果较为稳定,容易实施。通过进一步优化参数、增加信号过滤和止盈/止损策略,可以使策略更加可靠与智能化,具有较高的实战价值。
策略源码
/*backtest
start: 2022-12-19 00:00:00
end: 2023-12-25 00:00:00
period: 1d
basePeriod: 1h
exchanges: [{"eid":"Futures_Binance","currency":"BTC_USDT"}]
*/

//@version=2
strategy("ZendicatoR", overlay=true, calc_on_order_fills= true, calc_on_every_tick=true, default_qty_type=strategy.percent_of_equity, default_qty_value=15, pyramiding=0)
dt = input(defval=0.0010, title="Decision Threshold", type=float, step=0.0001)
keh=input(title="Double HullMA Cross",defval=7, minval=1)
che1=input(title="MA 1",defval=34,minval=1)
che2=input(title="MA 2",defval=144,minval=1)
che3=input(title="MA 3",defval=377,minval=1)
amnt=input(title="TP ($)",defval=4200,minval=1)
wma1=wma(close,che1)
wma2=wma(close,che2)
wma3=wma(close,che3)
sma1=sma(close,11)
tms=10000000000000
A=request.security(syminfo.tickerid, 'D', close)*tms
B=request.security(syminfo.tickerid, 'D', close[1])*tms
C=A>B?green:red
D=wma2>wma3?green:red
plot(wma1,style=line,color=C,linewidth=4)
p1=plot(wma2,style=line,color=D)
p2=plot(wma3,style=line,color=D)
fill(p1, p2, color=D, transp=75)
n2ma=2*wma(close,round(keh/2))
nma=wma(close,keh)
diff=n2ma-nma,sqn=round(sqrt(keh))
n2ma1=2*wma(close[2],round(keh/2))
nma1=wma(close[2],keh)
diff1=n2ma1-nma1,sqn1=round(sqrt(keh))
n1=wma(diff,sqn)*tms
n2=wma(diff1,sqn)*tms
Q=n1>n2?blue:yellow
plot(sma1,style=line,color=Q,linewidth=4)
closelong = A*tms<B*tms and n2*tms>n1*tms and strategy.openprofit>amnt
if (closelong)
    strategy.close("Long")
closeshort = A*tms>B*tms and n1*tms>n2*tms and strategy.openprofit>amnt
if (closeshort)
    strategy.close("Short")
longCondition = A*tms>B*tms and n1*tms>n2*tms
if (longCondition)
    strategy.entry("Long",strategy.long)
shortCondition = A*tms<B*tms and n1*tms<n2*tms
if (shortCondition)
    strategy.entry("Short",strategy.short)