概述
动量均线信封交易策略是一种趋势跟踪策略。它通过设置移动均线以及上下两个百分比区间作为买卖信号。当价格突破上行或下行区间时产生交易信号。该策略既可以用于趋势跟踪,也可以用于识别超买超卖的市场状态。
策略原理
该策略基于长度为14的简单移动均线。上行百分比区间计算为:移动均线 + 移动均线 × 输入的百分比数值。下行百分比区间计算为:移动均线 - 移动均线 × 输入的百分比数值。这样就形成了上下平行的交易区间带。
当收盘价格大于上行区间时,做多;当收盘价格小于下行区间时,做空。否则保持空仓。输入参数“reverse”可实现反向操作。
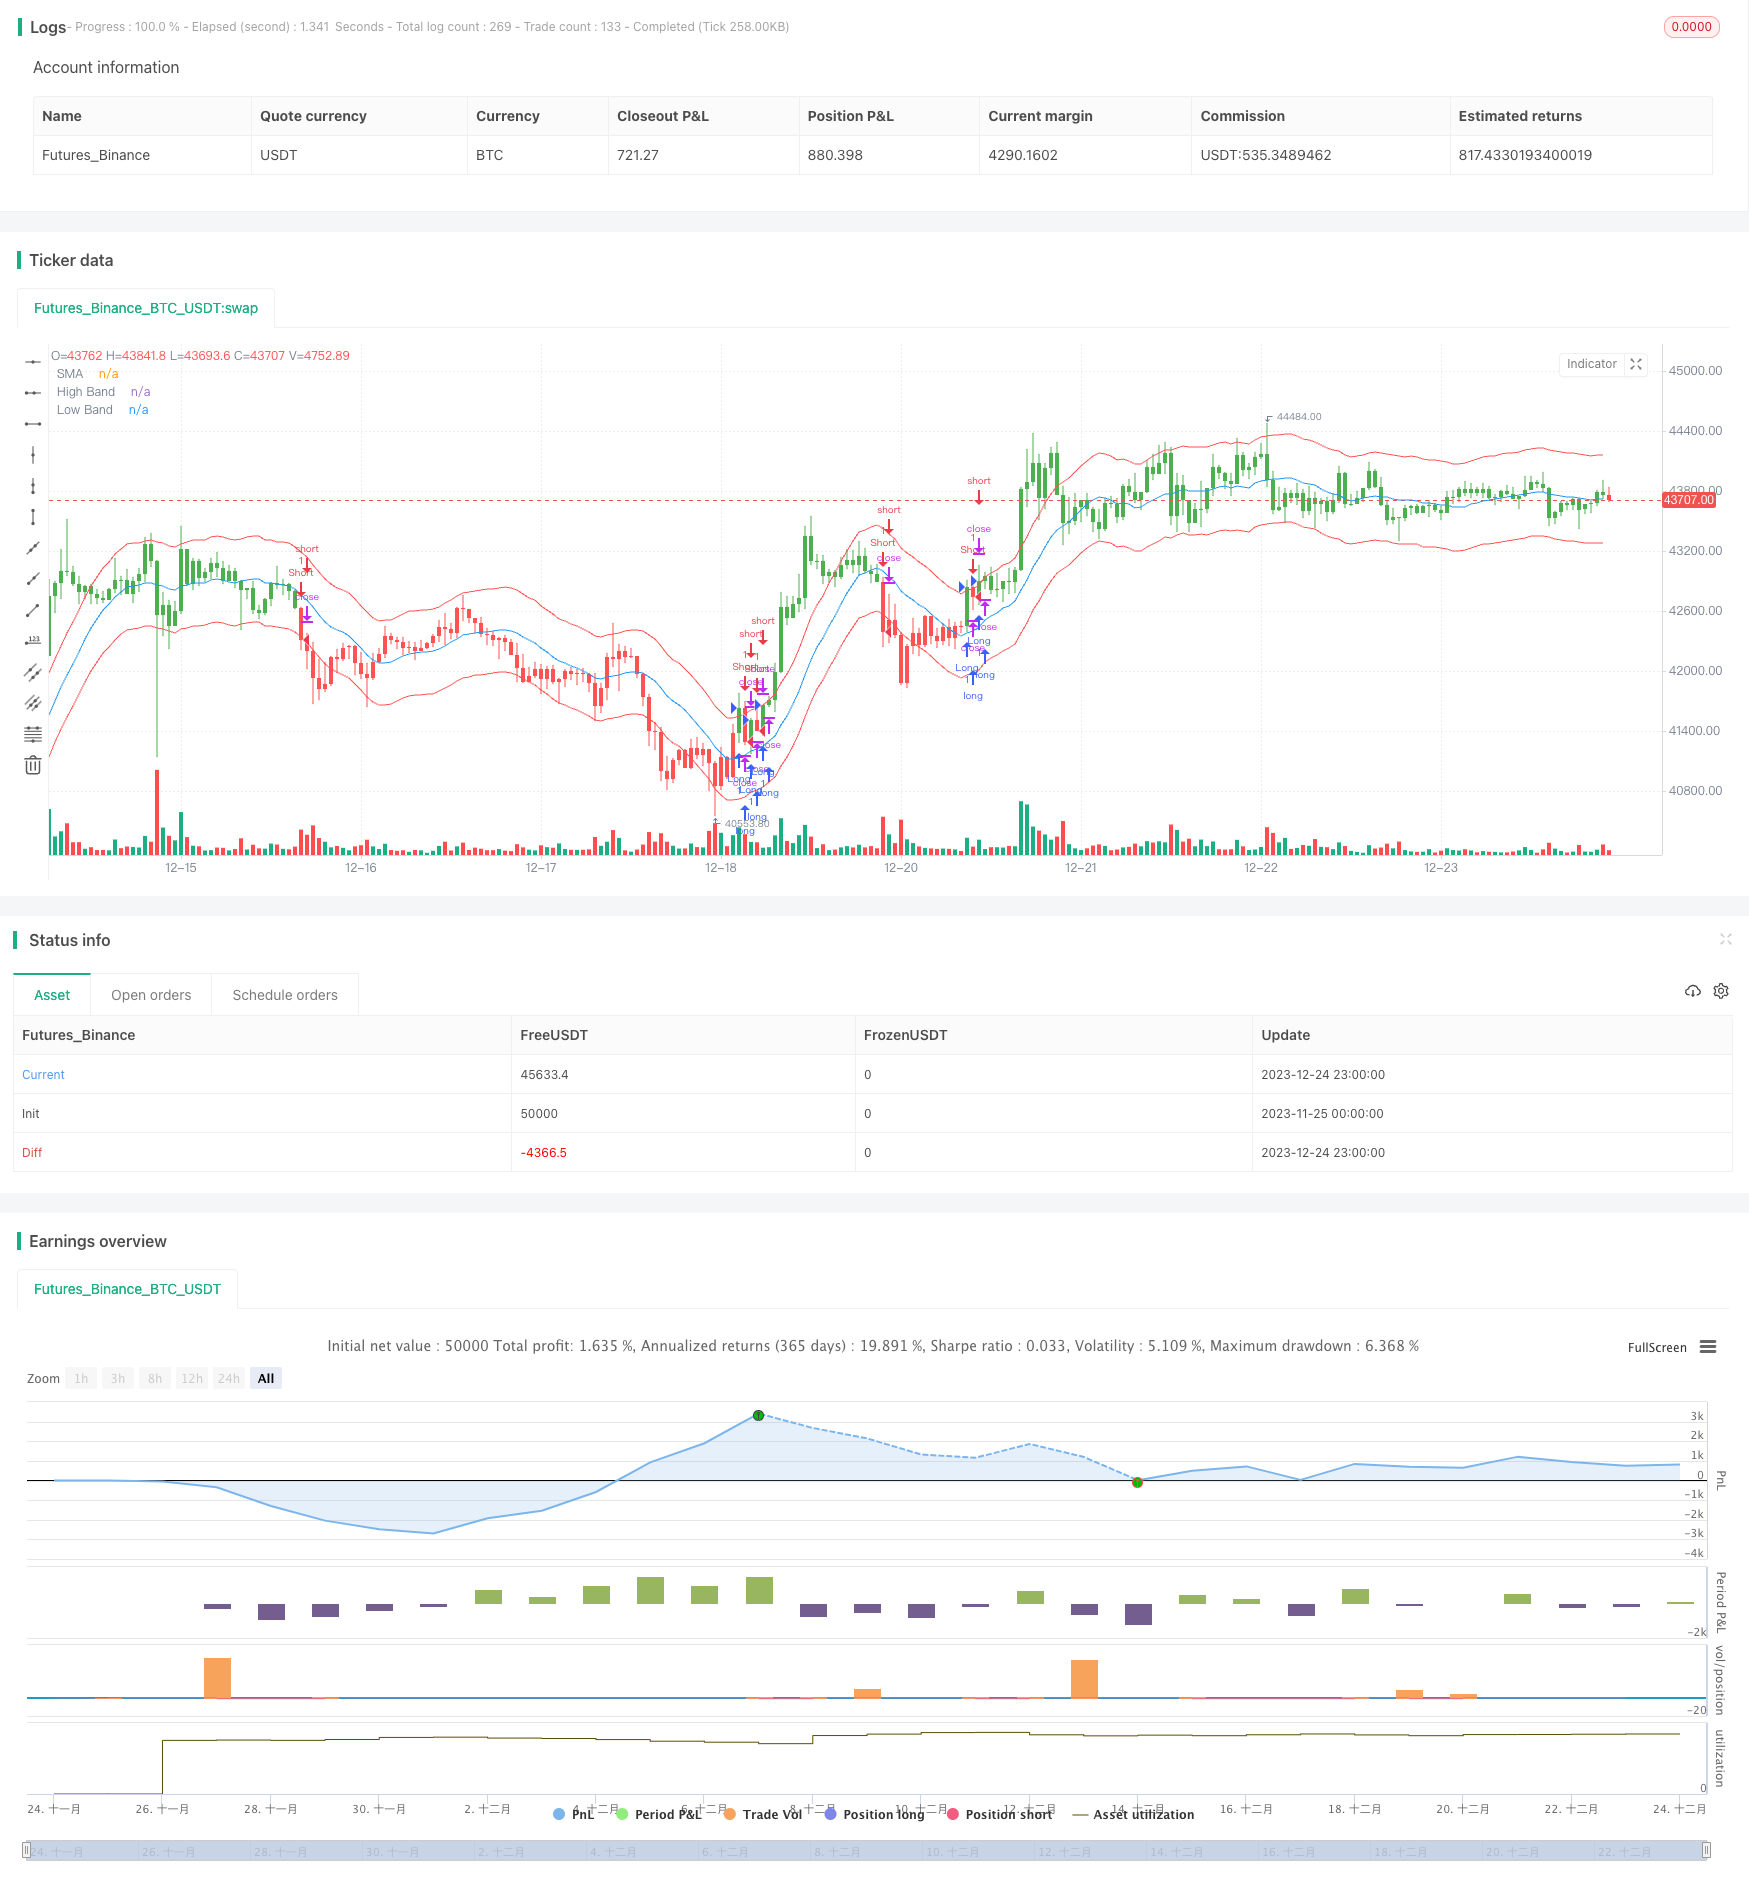
该策略使用了3个指标:
xSMA - 14周期的简单移动均线,代表中线。
xHighBand - 上行百分比区间。
xLowBand - 下行百分比区间。
策略优势
该策略具有以下优势:
规则清晰,容易理解和实现。
可用于趋势跟踪,也可用于识别超买超卖。避免在震荡行情中错失方向。
通过调整百分比区间参数,可以控制交易频率。降低交易风险。
可灵活选择移动均线周期,适用于不同周期和市场品种。
反向输入参数增加策略灵活性。可顺势操作,也可逆势操作。
风险及解决方法
该策略也存在一些风险:
在强势趋势中,有可能出现超过区间范围的深度拉升或回落。导致错过部分利润。可通过降低百分比区间控制风险。
在震荡行情中,可能出现频繁的错误交易信号。可通过增加移动均线周期来过滤信号。
区间范围较小时,价格可能出现频繁触及上下区间的情况。交易频率过高增加交易成本和滑点损失。可适当扩大区间范围。
快速变化的突发事件可能导致策略亏损。建议结合止损来管理风险。
策略优化
该策略可从以下几个方面进行优化:
测试不同长度周期的移动均线,选择产生信号最佳的周期参数。
优化上下百分比区间参数,找到最大化盈利且风险可控的组合参数。
添加其他技术指标作为过滤器,避免在震荡和复杂行情中产生错误信号。例如MACD,KD等。
结合趋势判断指标,改进入场timing。例如ADX,中断等。
测试不同品种参数实效性。调整参数适应不同交易品种。
结合止损策略,限制单笔亏损风险。
总结
动量均线信封交易策略整体来说是一个典型的趋势跟踪策略。它参数设置简单,易于理解和回测。同时也可用于判断超买超卖的复杂行情。通过参数优化和指标组合,可以大幅提高策略实盘效果。该策略值得进一步研究和应用。
/*backtest
start: 2023-11-25 00:00:00
end: 2023-12-25 00:00:00
period: 1h
basePeriod: 15m
exchanges: [{"eid":"Futures_Binance","currency":"BTC_USDT"}]
*/

//@version=2
////////////////////////////////////////////////////////////
//  Copyright by HPotter v1.0 04/03/2018
// Moving Average Envelopes are percentage-based envelopes set above and
// below a moving average. The moving average, which forms the base for
// this indicator, can be a simple or exponential moving average. Each
// envelope is then set the same percentage above or below the moving average.
// This creates parallel bands that follow price action. With a moving average
// as the base, Moving Average Envelopes can be used as a trend following indicator.
// However, this indicator is not limited to just trend following. The envelopes
// can also be used to identify overbought and oversold levels when the trend is
// relatively flat.
//
// You can change long to short in the Input Settings
// WARNING:
//  - For purpose educate only
//  - This script to change bars colors.
////////////////////////////////////////////////////////////
strategy(title="Moving Average Envelopes", overlay = true)
Length = input(14, minval=1)
PercentShift = input(1, minval = 0.01, step = 0.01)
reverse = input(false, title="Trade reverse")
xSMA = sma(close, Length)
xHighBand = xSMA + (xSMA * PercentShift / 100)
xLowBand = xSMA - (xSMA * PercentShift / 100)
pos = iff(close > xHighBand, 1,
       iff(close <xLowBand, -1, nz(pos[1], 0)))
possig = iff(reverse and pos == 1, -1,
          iff(reverse and pos == -1, 1, pos))
if (possig == 1)
    strategy.entry("Long", strategy.long)
if (possig == -1)
    strategy.entry("Short", strategy.short)
barcolor(possig == -1 ? red: possig == 1 ? green : blue )
plot(xSMA, color=blue, title="SMA")
plot(xHighBand, color=red, title="High Band")
plot(xLowBand, color=red, title="Low Band")